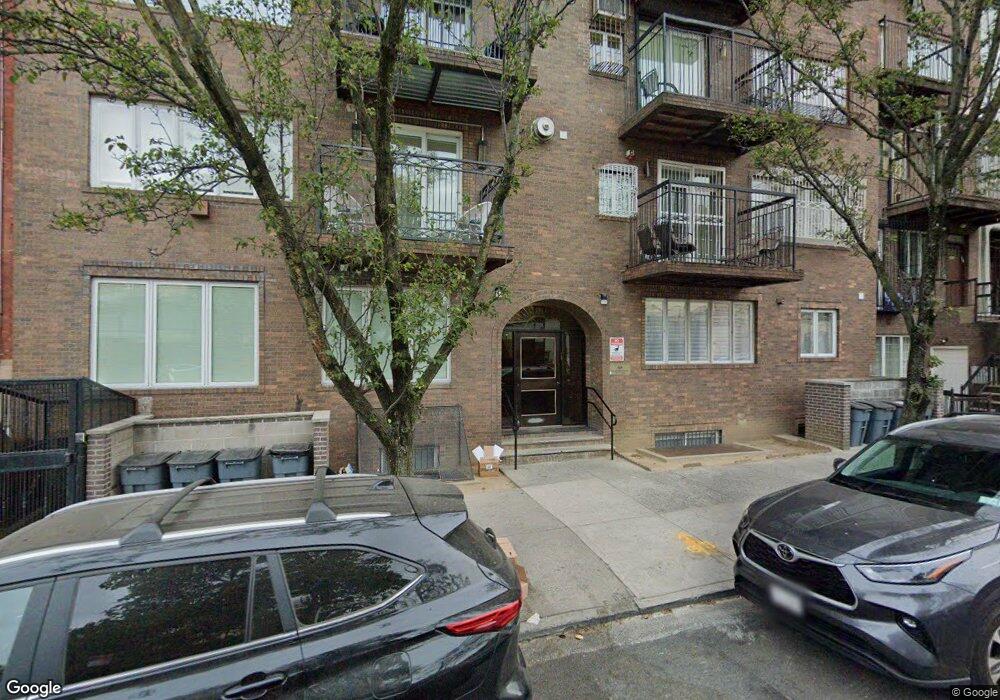
266 Keap St Unit 4R Brooklyn, NY 11211
South Williamsburg NeighborhoodEstimated Value: $1,315,000 - $1,519,000
--
Bed
--
Bath
1,973
Sq Ft
$717/Sq Ft
Est. Value
About This Home
This home is located at 266 Keap St Unit 4R, Brooklyn, NY 11211 and is currently estimated at $1,415,410, approximately $717 per square foot. 266 Keap St Unit 4R is a home located in Kings County with nearby schools including Ps 380 John Wayne Elementary School, Bnos Yakov School For Girls, and Talmud Torah Of Kasho.
Ownership History
Date
Name
Owned For
Owner Type
Purchase Details
Closed on
Feb 7, 2008
Sold by
Steinmetz David
Bought by
266 4R Llc
Current Estimated Value
Home Financials for this Owner
Home Financials are based on the most recent Mortgage that was taken out on this home.
Original Mortgage
$200,000
Outstanding Balance
$126,507
Interest Rate
6.2%
Mortgage Type
Purchase Money Mortgage
Estimated Equity
$1,288,903
Purchase Details
Closed on
Jan 22, 2008
Sold by
Schwimmer Cheskel and Schwimmer Goldie
Bought by
Steinmetz David
Home Financials for this Owner
Home Financials are based on the most recent Mortgage that was taken out on this home.
Original Mortgage
$200,000
Outstanding Balance
$126,507
Interest Rate
6.2%
Mortgage Type
Purchase Money Mortgage
Estimated Equity
$1,288,903
Purchase Details
Closed on
Dec 1, 2002
Sold by
266 Keap Street Owners Corp
Bought by
Schwimmer Cheskel and Schwimmer Goldie
Create a Home Valuation Report for This Property
The Home Valuation Report is an in-depth analysis detailing your home's value as well as a comparison with similar homes in the area
Home Values in the Area
Average Home Value in this Area
Purchase History
| Date | Buyer | Sale Price | Title Company |
|---|---|---|---|
| 266 4R Llc | -- | -- | |
| 266 4R Llc | -- | -- | |
| Steinmetz David | $600,000 | -- | |
| Steinmetz David | $600,000 | -- | |
| Schwimmer Cheskel | -- | -- | |
| Schwimmer Cheskel | -- | -- |
Source: Public Records
Mortgage History
| Date | Status | Borrower | Loan Amount |
|---|---|---|---|
| Open | Steinmetz David | $200,000 | |
| Closed | Steinmetz David | $200,000 |
Source: Public Records
Tax History Compared to Growth
Tax History
| Year | Tax Paid | Tax Assessment Tax Assessment Total Assessment is a certain percentage of the fair market value that is determined by local assessors to be the total taxable value of land and additions on the property. | Land | Improvement |
|---|---|---|---|---|
| 2025 | $11,979 | $101,209 | $2,887 | $98,322 |
| 2024 | $11,979 | $109,347 | $2,887 | $106,460 |
| 2023 | $11,160 | $99,934 | $2,887 | $97,047 |
| 2022 | $8,352 | $98,697 | $2,887 | $95,810 |
| 2021 | $9,752 | $79,497 | $2,887 | $76,610 |
| 2020 | $4,882 | $91,609 | $2,887 | $88,722 |
| 2019 | $9,509 | $85,160 | $2,887 | $82,273 |
| 2018 | $8,961 | $85,460 | $2,887 | $82,573 |
| 2017 | $8,188 | $74,360 | $2,887 | $71,473 |
| 2016 | $7,702 | $68,173 | $2,887 | $65,286 |
| 2015 | $4,688 | $63,823 | $2,887 | $60,936 |
| 2014 | $4,688 | $60,449 | $2,888 | $57,561 |
Source: Public Records
Map
Nearby Homes
- 323 S 5th St Unit TWNH
- 307 S 4th St
- 360 S 3rd St
- 330 S 3rd St Unit 1
- 272 S 5th St Unit A2
- 40 Bleecker St Unit 5D
- 40 Bleecker St Unit 3H
- 40 Bleecker St Unit 3E
- 256 S 4th St Unit 4
- 374 S 2nd St Unit 33
- 251 S 3rd St Unit 5B
- 251 S 3rd St Unit PHA
- 397 S 2nd St
- 616 Bedford Ave Unit 5C
- 616 Bedford Ave Unit 6B
- 616 Bedford Ave Unit 5A
- 373 S 1st St
- 277 S 2nd St
- 225 S 3rd St Unit 2
- 90 Heyward St
- 266 Keap St Unit 6M
- 266 Keap St Unit 6R
- 266 Keap St Unit 6L
- 266 Keap St Unit 5R
- 266 Keap St Unit 5L
- 266 Keap St Unit 4L
- 266 Keap St Unit 3R
- 266 Keap St Unit 3L
- 266 Keap St Unit 2R
- 266 Keap St Unit 2L
- 266 Keap St Unit 1R
- 266 Keap St Unit 1L
- 266 Keap St
- 262 Keap St
- 270 Keap St
- 260 Keap St
- 272 Keap St
- 258 Keap St
- 274 Keap St
- 253 Hooper St