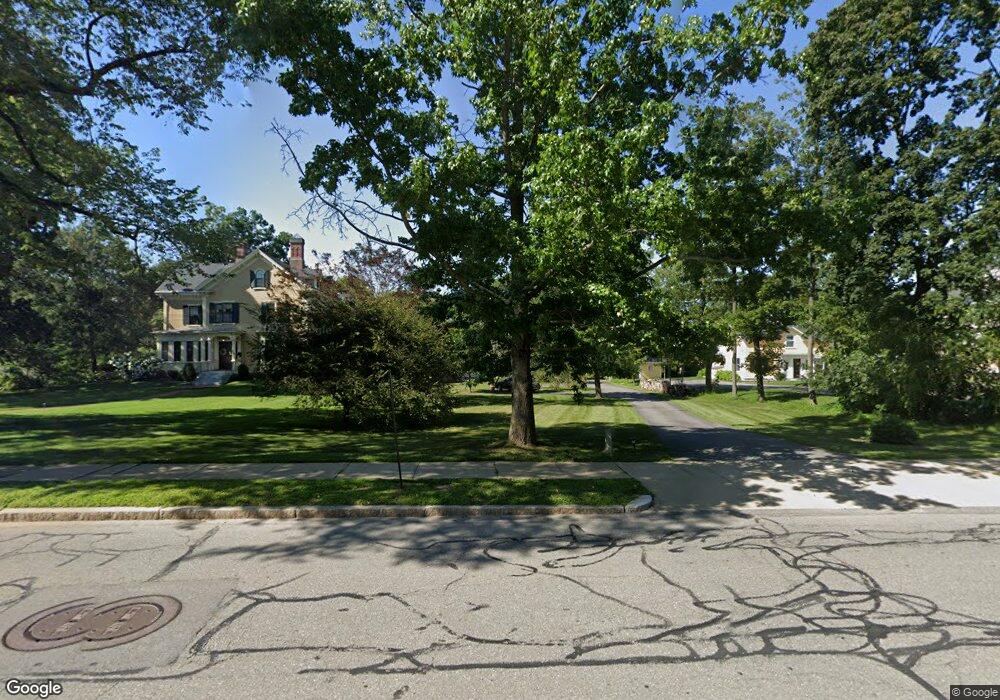
266 Main St Concord, MA 01742
Estimated Value: $2,138,000 - $3,230,000
3
Beds
3
Baths
3,284
Sq Ft
$847/Sq Ft
Est. Value
About This Home
This home is located at 266 Main St, Concord, MA 01742 and is currently estimated at $2,780,094, approximately $846 per square foot. 266 Main St is a home located in Middlesex County with nearby schools including Alcott Elementary School, Concord Middle School, and Concord Carlisle High School.
Ownership History
Date
Name
Owned For
Owner Type
Purchase Details
Closed on
Apr 2, 2013
Sold by
Funkhouser Elmer N
Bought by
Elmer N Funkhouser 3Rd and Funkhouser Elmer N
Current Estimated Value
Purchase Details
Closed on
Mar 23, 2006
Sold by
Wolfe Rt and Wolfe Jack E
Bought by
Funkhouser Elmer N
Create a Home Valuation Report for This Property
The Home Valuation Report is an in-depth analysis detailing your home's value as well as a comparison with similar homes in the area
Home Values in the Area
Average Home Value in this Area
Purchase History
| Date | Buyer | Sale Price | Title Company |
|---|---|---|---|
| Elmer N Funkhouser 3Rd | -- | -- | |
| Funkhouser Elmer N | $800,000 | -- |
Source: Public Records
Tax History
| Year | Tax Paid | Tax Assessment Tax Assessment Total Assessment is a certain percentage of the fair market value that is determined by local assessors to be the total taxable value of land and additions on the property. | Land | Improvement |
|---|---|---|---|---|
| 2025 | $365 | $2,752,400 | $1,508,600 | $1,243,800 |
| 2024 | $35,855 | $2,730,800 | $1,508,600 | $1,222,200 |
| 2023 | $28,933 | $2,232,500 | $1,234,200 | $998,300 |
| 2022 | $28,138 | $1,906,400 | $987,200 | $919,200 |
| 2021 | $27,674 | $1,880,000 | $987,200 | $892,800 |
| 2020 | $26,949 | $1,893,800 | $987,200 | $906,600 |
| 2019 | $27,031 | $1,904,900 | $1,029,600 | $875,300 |
| 2018 | $25,408 | $1,778,000 | $912,900 | $865,100 |
| 2017 | $23,788 | $1,690,700 | $837,200 | $853,500 |
| 2016 | $23,717 | $1,703,800 | $837,200 | $866,600 |
| 2015 | $22,592 | $1,581,000 | $775,300 | $805,700 |
Source: Public Records
Map
Nearby Homes
- 3 Nashawtuc Rd
- 34 Thoreau St Unit 34
- 32 Thoreau St Unit 32
- 22 Belknap Ct
- 46 Sudbury Rd
- 265 Elsinore St
- 150 Hubbard St Unit B
- 106 Elm St
- 49 Willard Common
- 2 Willard Common
- 29 Willard Common
- 143 Everett St
- 165 Everett St
- 181 Stow St
- 315 Musketaquid Rd
- 244 Musterfield Rd
- 236 Fairhaven Rd
- 61B Walden St
- 50 Wayside Rd
- 25 Fairhaven Rd
- 276 Main St
- 252 Main St
- 252 Main St Unit 1
- 252 Main St Unit A
- Lot 3A-2 Nashawtuc Rd
- 238 Main St
- 300 Main St
- 255 Main St
- 277 Main St
- 267 Main St
- 245 Main St
- 293 Main St
- 310 Main St
- 235 Main St
- 21 Thoreau St
- 31 Thoreau St
- 307 Main St
- 307 Main St Unit ID1261189P
- 307 Main St Unit ID1261190P
- 58 Belknap St
Your Personal Tour Guide
Ask me questions while you tour the home.