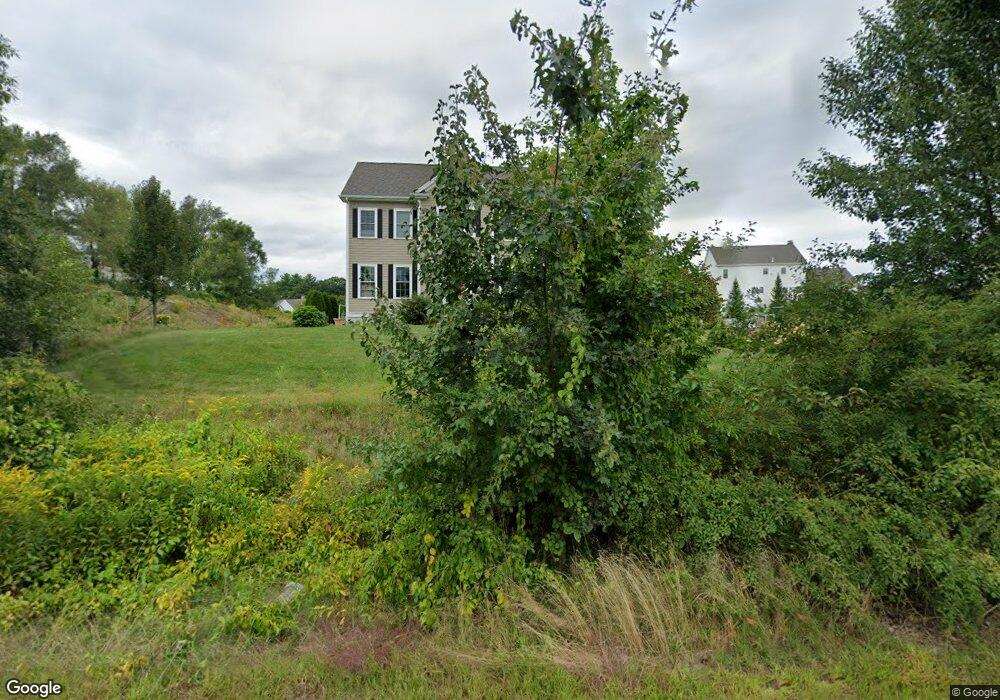
266 Main St Norfolk, MA 02056
Estimated Value: $882,138 - $984,000
3
Beds
3
Baths
2,400
Sq Ft
$391/Sq Ft
Est. Value
About This Home
This home is located at 266 Main St, Norfolk, MA 02056 and is currently estimated at $937,785, approximately $390 per square foot. 266 Main St is a home with nearby schools including H. Olive Day School, Freeman-Kennedy School, and Woodside Montessori Academy.
Ownership History
Date
Name
Owned For
Owner Type
Purchase Details
Closed on
Aug 2, 2010
Sold by
Norfolk Inv Co Llc
Bought by
Hunt Erin M and Whinnem Brooke
Current Estimated Value
Home Financials for this Owner
Home Financials are based on the most recent Mortgage that was taken out on this home.
Original Mortgage
$360,200
Outstanding Balance
$241,000
Interest Rate
4.78%
Mortgage Type
Purchase Money Mortgage
Estimated Equity
$696,785
Create a Home Valuation Report for This Property
The Home Valuation Report is an in-depth analysis detailing your home's value as well as a comparison with similar homes in the area
Home Values in the Area
Average Home Value in this Area
Purchase History
| Date | Buyer | Sale Price | Title Company |
|---|---|---|---|
| Hunt Erin M | $494,000 | -- | |
| Norfolk Inv Co Llc | -- | -- |
Source: Public Records
Mortgage History
| Date | Status | Borrower | Loan Amount |
|---|---|---|---|
| Open | Hunt Erin M | $360,200 |
Source: Public Records
Tax History Compared to Growth
Tax History
| Year | Tax Paid | Tax Assessment Tax Assessment Total Assessment is a certain percentage of the fair market value that is determined by local assessors to be the total taxable value of land and additions on the property. | Land | Improvement |
|---|---|---|---|---|
| 2025 | $12,939 | $810,200 | $224,400 | $585,800 |
| 2024 | $12,375 | $794,800 | $237,000 | $557,800 |
| 2023 | $11,843 | $721,700 | $226,500 | $495,200 |
| 2022 | $11,020 | $605,500 | $209,700 | $395,800 |
| 2021 | $10,152 | $564,300 | $184,400 | $379,900 |
| 2020 | $10,314 | $553,300 | $176,300 | $377,000 |
| 2019 | $9,915 | $542,100 | $176,300 | $365,800 |
| 2018 | $9,204 | $494,300 | $162,200 | $332,100 |
| 2017 | $9,068 | $497,700 | $162,200 | $335,500 |
| 2016 | $8,792 | $486,300 | $158,600 | $327,700 |
| 2015 | $8,516 | $482,200 | $151,100 | $331,100 |
| 2014 | $8,328 | $477,800 | $151,100 | $326,700 |
Source: Public Records
Map
Nearby Homes
- 10 Medway St
- 16 Keeney Pond Rd
- 18 Keeney Pond Rd
- 12 Keeney Pond Rd
- 7 Keeney Pond Rd
- 3 Lake St
- 6 Trailside Way
- 4 Cleveland St
- 118 Main St
- 23 Fredrickson Rd
- 41 Myrtle St
- 8 Analore Cir
- 26 Ridge Rd
- 8 Boyde's Crossing
- 8 Boyde's Crossing Unit 4
- 25 Boydes Crossing Unit 18
- 3 Pheasanthill Rd
- 37 Wildwood Rd Unit 37
- 29 Wildwood Rd Unit 29
- 14 Essex St
- 264 Main St
- 268 Main St
- 9 Canterberry Ln
- 7 Canterberry Ln
- 11 Canterberry Ln
- 253 Main St
- 255 Main St
- 270 Main St
- 262 Main St
- 13 Canterberry Ln
- 14 Canterberry Ln
- 1 Sweetland Farm Rd
- 12 Canterberry Ln
- 15 Canterberry Ln
- 257 Main St
- 5 Canterberry Ln
- 10 Canterberry Ln
- 272 Main St
- 3 Canterberry Ln
- 16 Canterberry Ln