266 Miller Ave Unit 8 Columbus, OH 43205
Franklin Park NeighborhoodEstimated Value: $296,293 - $512,000
6
Beds
2
Baths
2,256
Sq Ft
$178/Sq Ft
Est. Value
About This Home
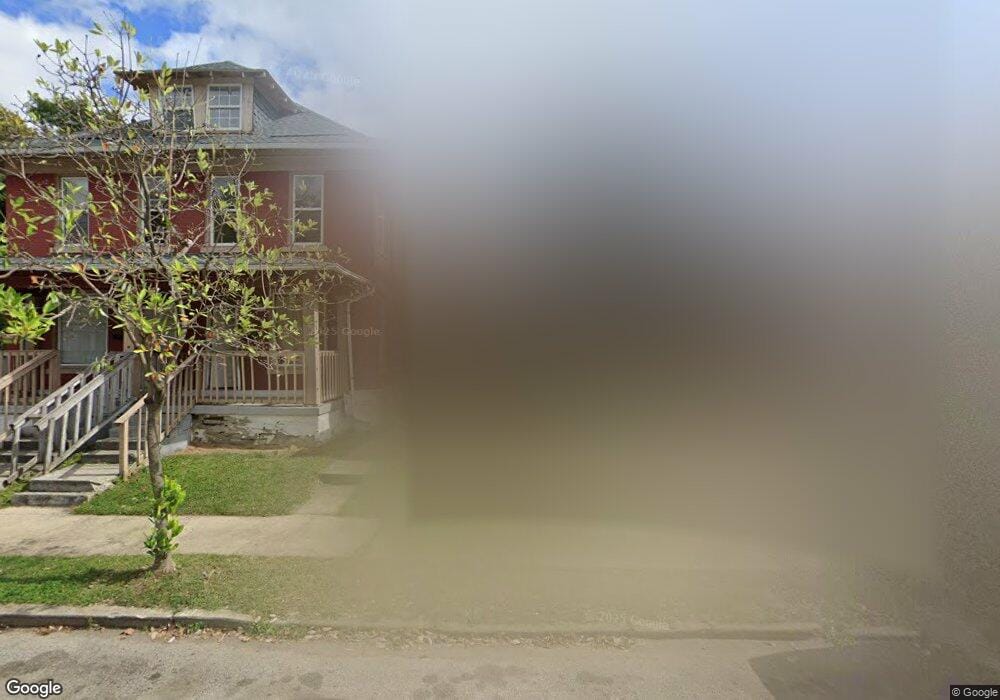
This home is located at 266 Miller Ave Unit 8, Columbus, OH 43205 and is currently estimated at $400,823, approximately $177 per square foot. 266 Miller Ave Unit 8 is a home located in Franklin County with nearby schools including Ohio Avenue Elementary School, Champion Middle School, and East High School.
Ownership History
Date
Name
Owned For
Owner Type
Purchase Details
Closed on
Dec 4, 2019
Sold by
Frye Justin A
Bought by
Frye Justin A and Mathys Frye Kecia
Current Estimated Value
Home Financials for this Owner
Home Financials are based on the most recent Mortgage that was taken out on this home.
Original Mortgage
$227,500
Outstanding Balance
$200,574
Interest Rate
3.6%
Mortgage Type
New Conventional
Estimated Equity
$200,249
Purchase Details
Closed on
Mar 31, 2017
Sold by
Rivendell Properties Llc
Bought by
Frye Justin A
Home Financials for this Owner
Home Financials are based on the most recent Mortgage that was taken out on this home.
Original Mortgage
$163,124
Interest Rate
4.5%
Mortgage Type
FHA
Purchase Details
Closed on
Dec 8, 2014
Sold by
Hilaman Elliot
Bought by
Rivendell Properties Llc
Purchase Details
Closed on
Aug 30, 2014
Sold by
Miller Warner
Bought by
Hilaman Elliot
Purchase Details
Closed on
Nov 22, 2011
Sold by
Miller Warner
Bought by
Freeman Shelid
Purchase Details
Closed on
Oct 30, 1986
Bought by
Miller Warner
Create a Home Valuation Report for This Property
The Home Valuation Report is an in-depth analysis detailing your home's value as well as a comparison with similar homes in the area
Home Values in the Area
Average Home Value in this Area
Purchase History
| Date | Buyer | Sale Price | Title Company |
|---|---|---|---|
| Frye Justin A | -- | Landsel Title | |
| Frye Justin A | $136,000 | None Available | |
| Rivendell Properties Llc | -- | None Available | |
| Hilaman Elliot | $12,000 | Stewart Title | |
| Freeman Shelid | $36,000 | Attorney | |
| Miller Warner | $15,500 | -- |
Source: Public Records
Mortgage History
| Date | Status | Borrower | Loan Amount |
|---|---|---|---|
| Open | Frye Justin A | $227,500 | |
| Closed | Frye Justin A | $163,124 | |
| Closed | Freeman Shelid | $0 |
Source: Public Records
Tax History Compared to Growth
Tax History
| Year | Tax Paid | Tax Assessment Tax Assessment Total Assessment is a certain percentage of the fair market value that is determined by local assessors to be the total taxable value of land and additions on the property. | Land | Improvement |
|---|---|---|---|---|
| 2024 | $3,146 | $68,640 | $29,020 | $39,620 |
| 2023 | $3,256 | $68,635 | $29,015 | $39,620 |
| 2022 | $3,312 | $59,500 | $3,850 | $55,650 |
| 2021 | $3,318 | $59,500 | $3,850 | $55,650 |
| 2020 | $3,322 | $59,500 | $3,850 | $55,650 |
| 2019 | $3,074 | $47,600 | $3,080 | $44,520 |
| 2018 | $2,133 | $47,600 | $3,080 | $44,520 |
| 2017 | $1,761 | $28,320 | $3,080 | $25,240 |
| 2016 | $1,306 | $19,220 | $3,330 | $15,890 |
| 2015 | $608 | $19,220 | $3,330 | $15,890 |
| 2014 | $1,192 | $19,220 | $3,330 | $15,890 |
| 2013 | $534 | $17,465 | $3,010 | $14,455 |
Source: Public Records
Map
Nearby Homes
- 266 Miller Ave Unit 268
- 238-240 Miller Ave
- 1455 Franklin Ave
- 1513 Franklin Ave
- 336 Loeffler Ave
- 1571 Franklin Ave
- 356 Miller Ave
- 1591 Franklin Ave
- 362 Loeffler Ave
- 1596 Franklin Ave Unit 598
- 838 Bryden Rd
- 1555 E Rich St Unit 557
- 939 E Rich St
- 1469 E Rich St
- 1230 E Main St
- 1673 E Main St
- 1029 Franklin Ave
- 1669-1671 Oak St
- 1318 Oak St
- 347 Kendall Place
- 266-268 Miller Ave
- 264 Miller Ave
- 262 Miller Ave Unit 264
- 262-264 Miller Ave
- 274 Miller Ave
- 276 Miller Ave
- 284 Miller Ave
- 248 Miller Ave
- 1501-1503 Franklin Ave
- 1501 Franklin Ave Unit 503
- 1498 Franklin Ave
- 1503 Franklin Ave
- 246 Miller Ave
- 246 Miller Ave Unit 1
- 243 Miller Ave Unit 247
- 1507 Franklin Ave
- 1509 Franklin Ave
- 1484 Bryden Rd
- 241 Miller Ave
- 245 Miller Ave