Estimated Value: $823,000 - $1,004,000
3
Beds
3
Baths
2,482
Sq Ft
$364/Sq Ft
Est. Value
About This Home
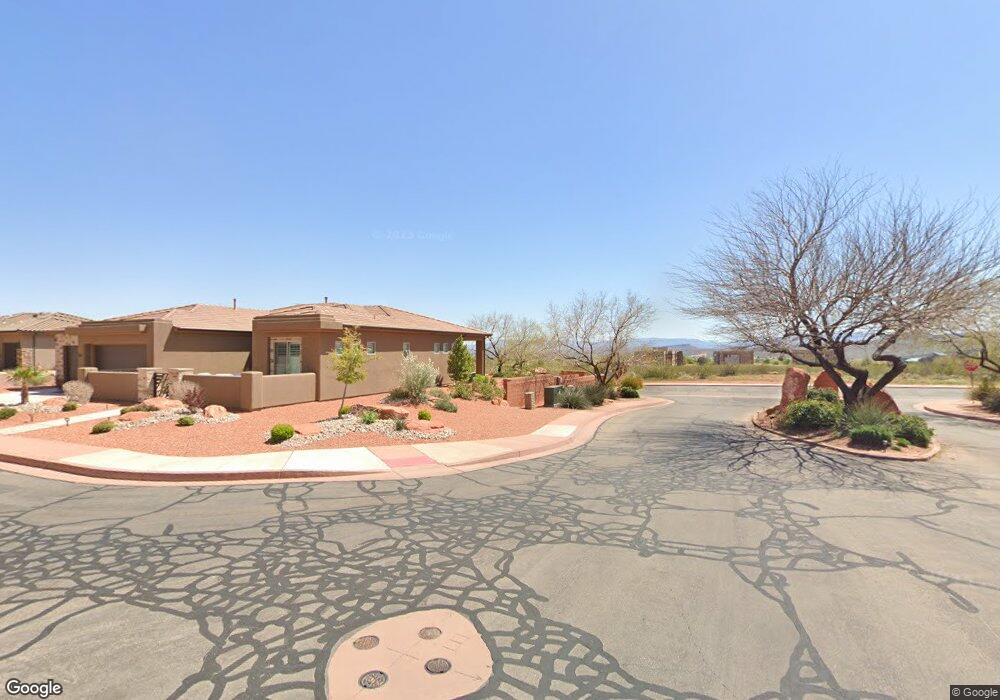
This home is located at 266 N 340 E, Ivins, UT 84738 and is currently estimated at $902,737, approximately $363 per square foot. 266 N 340 E is a home with nearby schools including Red Mountain School, Snow Canyon Middle School, and Lava Ridge Intermediate School.
Ownership History
Date
Name
Owned For
Owner Type
Purchase Details
Closed on
Aug 20, 2013
Sold by
Custom Contracting Corp
Bought by
Elstad Craig O and Elstad Nancy L
Current Estimated Value
Home Financials for this Owner
Home Financials are based on the most recent Mortgage that was taken out on this home.
Original Mortgage
$210,000
Outstanding Balance
$49,452
Interest Rate
3.34%
Mortgage Type
New Conventional
Estimated Equity
$853,285
Purchase Details
Closed on
Jan 31, 2013
Sold by
Ravello Development Llc
Bought by
Custom Contracting Corp
Home Financials for this Owner
Home Financials are based on the most recent Mortgage that was taken out on this home.
Original Mortgage
$294,500
Interest Rate
3.33%
Mortgage Type
Unknown
Purchase Details
Closed on
Jun 11, 2012
Sold by
Rbc Real Estate Finance Inc
Bought by
Ravello Development Llc
Purchase Details
Closed on
Jul 21, 2010
Sold by
Red Mountain Estates Llc
Bought by
Rbc Real Estate Finance Inc
Create a Home Valuation Report for This Property
The Home Valuation Report is an in-depth analysis detailing your home's value as well as a comparison with similar homes in the area
Purchase History
| Date | Buyer | Sale Price | Title Company |
|---|---|---|---|
| Elstad Craig O | -- | Southern Utah Title | |
| Custom Contracting Corp | -- | Skyview Title Insurance Agen | |
| Ravello Development Llc | -- | First Amer St George Main | |
| Rbc Real Estate Finance Inc | -- | None Available |
Source: Public Records
Mortgage History
| Date | Status | Borrower | Loan Amount |
|---|---|---|---|
| Open | Elstad Craig O | $210,000 | |
| Previous Owner | Custom Contracting Corp | $294,500 |
Source: Public Records
Tax History
| Year | Tax Paid | Tax Assessment Tax Assessment Total Assessment is a certain percentage of the fair market value that is determined by local assessors to be the total taxable value of land and additions on the property. | Land | Improvement |
|---|---|---|---|---|
| 2025 | $3,395 | $502,205 | $151,250 | $350,955 |
| 2023 | $3,247 | $475,860 | $137,500 | $338,360 |
| 2022 | $3,404 | $469,535 | $129,250 | $340,285 |
| 2021 | $2,838 | $581,700 | $145,000 | $436,700 |
| 2020 | $2,620 | $508,100 | $115,000 | $393,100 |
| 2019 | $2,620 | $496,800 | $95,000 | $401,800 |
| 2018 | $2,523 | $246,235 | $0 | $0 |
| 2017 | $2,407 | $228,580 | $0 | $0 |
| 2016 | $2,435 | $213,565 | $0 | $0 |
| 2015 | $2,505 | $211,475 | $0 | $0 |
| 2014 | $2,525 | $214,170 | $0 | $0 |
Source: Public Records
Map
Nearby Homes
- 463 E Red Desert Trail
- 165 E 350 N
- 155 E 200 N
- 125 E 300 N
- 1312 Willow Way 1 Unit 1
- 543 W Fox Tail Way
- 633 E Flint Rock Cir
- 676 E Palisades Dr
- 673 Coral Autumn Ln
- 310 N Main St
- 691 Crimson Flare Ln
- 163 S 480 E
- 851 E Posado St
- 185 W Center St
- 88 N Apex Ln
- 143 N Apex Ln
- 257 W Peaceful Ln
- 285 W 450 N
- 328 N Harrier Ln
- 411 E Majestic Dr
Your Personal Tour Guide
Ask me questions while you tour the home.