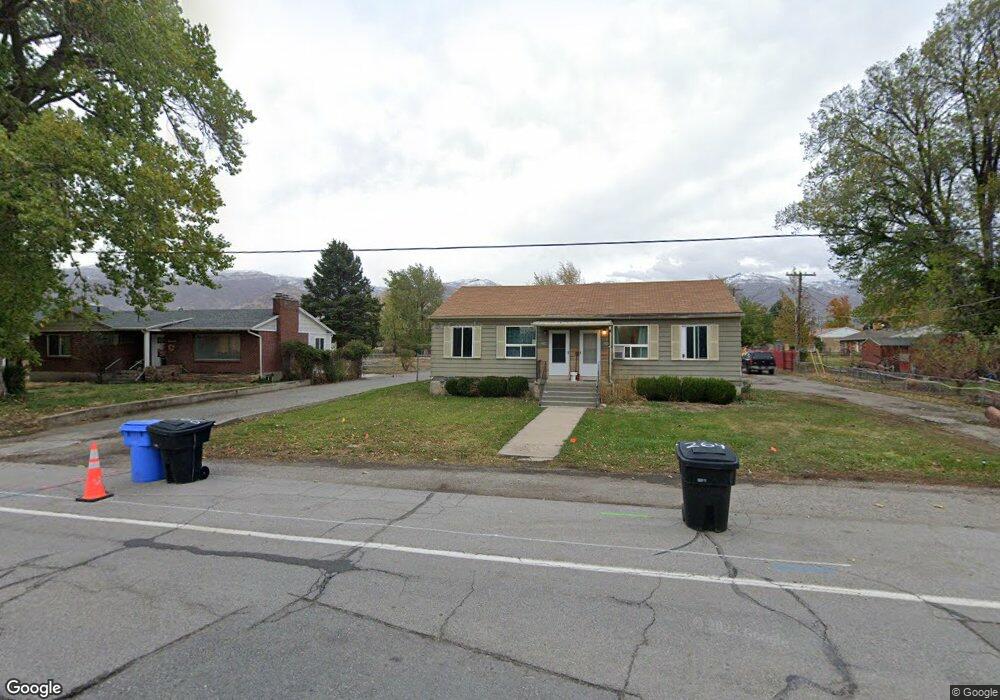
266 N 800 W West Bountiful, UT 84087
Estimated Value: $443,000 - $781,000
6
Beds
3
Baths
2,598
Sq Ft
$229/Sq Ft
Est. Value
About This Home
This home is located at 266 N 800 W, West Bountiful, UT 84087 and is currently estimated at $594,517, approximately $228 per square foot. 266 N 800 W is a home located in Davis County with nearby schools including West Bountiful Elementary School, Bountiful Junior High School, and Viewmont High School.
Ownership History
Date
Name
Owned For
Owner Type
Purchase Details
Closed on
Jan 12, 2018
Sold by
Fenton John T and Fenton Ashlee B
Bought by
Oasis Apartments Llc
Current Estimated Value
Home Financials for this Owner
Home Financials are based on the most recent Mortgage that was taken out on this home.
Original Mortgage
$268,100
Outstanding Balance
$225,483
Interest Rate
3.9%
Mortgage Type
New Conventional
Estimated Equity
$369,034
Purchase Details
Closed on
Oct 20, 2016
Sold by
Fenton John T and Fenton Ashlee B
Bought by
Oasis Apartments Llc
Purchase Details
Closed on
Nov 12, 2012
Sold by
Oasis Apartments Llc
Bought by
Fenton John Timothy and Fenton Ashlee Brynn
Purchase Details
Closed on
Feb 10, 2011
Sold by
Fenton John Timothy and Fenton Ashlee Brynn
Bought by
Oasis Apartments Llc
Purchase Details
Closed on
Oct 27, 2010
Sold by
Oasis Apartments Llc
Bought by
Fenton John Timothy and Fenton Ashlee Brynn
Purchase Details
Closed on
Dec 28, 2005
Sold by
Fenton Ashlee Brynn and Fenton John T
Bought by
Oasis Apartments Llc
Home Financials for this Owner
Home Financials are based on the most recent Mortgage that was taken out on this home.
Original Mortgage
$217,585
Interest Rate
6.31%
Mortgage Type
FHA
Purchase Details
Closed on
Dec 14, 2005
Sold by
Hardman Earl E
Bought by
Fenton Ashlee Brynn and Fenton John T
Home Financials for this Owner
Home Financials are based on the most recent Mortgage that was taken out on this home.
Original Mortgage
$217,585
Interest Rate
6.31%
Mortgage Type
FHA
Purchase Details
Closed on
Apr 10, 2002
Sold by
Hokanson Don C and Kirkham Milo
Bought by
Hardman Earl E
Home Financials for this Owner
Home Financials are based on the most recent Mortgage that was taken out on this home.
Original Mortgage
$174,757
Interest Rate
6.78%
Mortgage Type
FHA
Purchase Details
Closed on
Feb 2, 1998
Sold by
Arbuckle James K and Arbuckle Kent K
Bought by
Hokanson Don C and Kirkham Milo K
Purchase Details
Closed on
Oct 30, 1997
Sold by
Arbuckle James K and Arbuckle Kent K
Bought by
Hokanson Don C and Kirkham Milo K
Create a Home Valuation Report for This Property
The Home Valuation Report is an in-depth analysis detailing your home's value as well as a comparison with similar homes in the area
Home Values in the Area
Average Home Value in this Area
Purchase History
| Date | Buyer | Sale Price | Title Company |
|---|---|---|---|
| Oasis Apartments Llc | -- | Hickman Land Title | |
| Fenton John T | -- | Hickman Land Title | |
| Oasis Apartments Llc | -- | Hickman Land Title | |
| Fenton John T | -- | Hickman Land Title | |
| Fenton John Timothy | -- | North American Title | |
| Oasis Apartments Llc | -- | Accommodation | |
| Fenton John Timothy | -- | Aspen Title Insurance | |
| Oasis Apartments Llc | -- | -- | |
| Fenton Ashlee Brynn | -- | Equity Title Ins Agency Inc | |
| Hardman Earl E | -- | First American Title Co | |
| Hokanson Don C | -- | -- | |
| Hokanson Don C | -- | -- |
Source: Public Records
Mortgage History
| Date | Status | Borrower | Loan Amount |
|---|---|---|---|
| Open | Fenton John T | $268,100 | |
| Closed | Oasis Apartments Llc | $217,440 | |
| Previous Owner | Fenton Ashlee Brynn | $217,585 | |
| Previous Owner | Hardman Earl E | $174,757 |
Source: Public Records
Tax History
| Year | Tax Paid | Tax Assessment Tax Assessment Total Assessment is a certain percentage of the fair market value that is determined by local assessors to be the total taxable value of land and additions on the property. | Land | Improvement |
|---|---|---|---|---|
| 2025 | $3,555 | $306,351 | $168,535 | $137,816 |
| 2024 | $3,393 | $300,299 | $139,472 | $160,827 |
| 2023 | $3,339 | $299,200 | $141,685 | $157,514 |
| 2022 | $3,298 | $546,000 | $233,726 | $312,274 |
| 2021 | $2,849 | $396,000 | $183,075 | $212,925 |
| 2020 | $2,618 | $360,000 | $162,245 | $197,755 |
| 2019 | $2,605 | $355,000 | $157,885 | $197,115 |
| 2018 | $2,340 | $313,000 | $149,534 | $163,466 |
| 2016 | $2,232 | $163,185 | $47,896 | $115,289 |
| 2015 | $1,932 | $133,870 | $47,896 | $85,974 |
| 2014 | $1,811 | $129,250 | $47,896 | $81,354 |
| 2013 | -- | $118,924 | $29,915 | $89,009 |
Source: Public Records
Map
Nearby Homes
- 350 N 1100 W
- 290 N 500 W Unit 108
- 290 N 500 W Unit 305
- 401 W 400 N Unit 49
- 403 W 400 N Unit 1
- 33 Tierra Vista Ct
- 55 N Peregrine Ln W Unit 7
- 75 N Peregrine Ln W Unit 8
- 332 N 300 W
- 366 W 1000 N
- 499 N 200 W Unit 18
- 499 N 200 W Unit 19
- 563 N 200 W
- 1449 N 725 W
- 729 W 925 S
- 1059 W Audrey Ln Unit 10
- 1063 W Audrey Ln Unit 9
- 758 W 1000 S
- 1067 W Audrey Ln Unit 8
- 1075 W Audrey Ln Unit 6
Your Personal Tour Guide
Ask me questions while you tour the home.