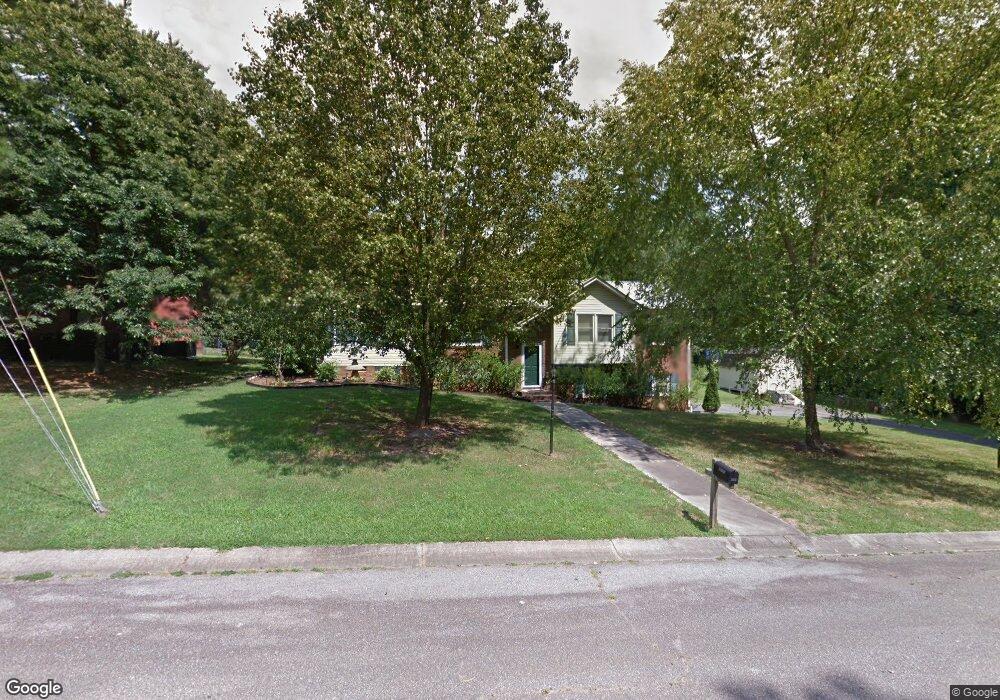
266 Northcrest Dr Kannapolis, NC 28081
Estimated Value: $337,000 - $394,000
Studio
2
Baths
2,132
Sq Ft
$176/Sq Ft
Est. Value
About This Home
This home is located at 266 Northcrest Dr, Kannapolis, NC 28081 and is currently estimated at $374,687, approximately $175 per square foot. 266 Northcrest Dr is a home located in Rowan County with nearby schools including Landis Elementary School, Corriher Lipe Middle School, and South Rowan High School.
Ownership History
Date
Name
Owned For
Owner Type
Purchase Details
Closed on
Jun 30, 2021
Sold by
Knight Joshua Adam
Bought by
Knight Nena Moore
Current Estimated Value
Home Financials for this Owner
Home Financials are based on the most recent Mortgage that was taken out on this home.
Original Mortgage
$270,000
Outstanding Balance
$246,271
Interest Rate
3.25%
Mortgage Type
New Conventional
Estimated Equity
$128,416
Purchase Details
Closed on
Oct 10, 2017
Sold by
Hammond Thomas E and Hammond Christina Lee
Bought by
Knight Joshua Adam and Knight Nena Moore
Home Financials for this Owner
Home Financials are based on the most recent Mortgage that was taken out on this home.
Original Mortgage
$187,210
Interest Rate
3.82%
Mortgage Type
New Conventional
Purchase Details
Closed on
Jun 27, 2003
Bought by
Schmidt Christina Lee
Create a Home Valuation Report for This Property
The Home Valuation Report is an in-depth analysis detailing your home's value as well as a comparison with similar homes in the area
Home Values in the Area
Average Home Value in this Area
Purchase History
| Date | Buyer | Sale Price | Title Company |
|---|---|---|---|
| Knight Nena Moore | -- | None Available | |
| Moore Knight Nena | -- | None Listed On Document | |
| Knight Joshua Adam | $193,000 | None Available | |
| Schmidt Christina Lee | -- | -- |
Source: Public Records
Mortgage History
| Date | Status | Borrower | Loan Amount |
|---|---|---|---|
| Open | Moore Knight Nena | $270,000 | |
| Closed | Moore Knight Nena | $270,000 | |
| Previous Owner | Knight Joshua Adam | $187,210 |
Source: Public Records
Tax History
| Year | Tax Paid | Tax Assessment Tax Assessment Total Assessment is a certain percentage of the fair market value that is determined by local assessors to be the total taxable value of land and additions on the property. | Land | Improvement |
|---|---|---|---|---|
| 2025 | $2,222 | $336,709 | $72,599 | $264,110 |
| 2024 | $2,222 | $336,709 | $72,599 | $264,110 |
| 2023 | $2,222 | $336,709 | $72,599 | $264,110 |
| 2022 | $1,604 | $217,538 | $45,793 | $171,745 |
| 2021 | $1,604 | $217,538 | $45,793 | $171,745 |
| 2020 | $1,604 | $217,538 | $45,793 | $171,745 |
| 2019 | $1,604 | $217,538 | $45,793 | $171,745 |
| 2018 | $1,186 | $162,186 | $45,764 | $116,422 |
| 2017 | $1,186 | $162,186 | $45,764 | $116,422 |
| 2016 | $1,170 | $162,186 | $45,764 | $116,422 |
| 2015 | $1,189 | $162,186 | $45,764 | $116,422 |
| 2014 | $1,201 | $166,760 | $45,764 | $120,996 |
Source: Public Records
Map
Nearby Homes
- 115 Northcrest Dr
- 117 S Enochville Ave
- 6621 Charlie Walker Rd
- 6443 Roanoke Dr
- 1814 W C St
- 2218 Woodcrest Dr
- 1809 W C St
- 6124 Avalon Dr
- 113 Hilton Ave
- 1711 W C St
- 6231 Kentwood Dr
- 0000 Buffalo St
- 6360 Pagemont Rd
- 6340 Pagemont Rd
- 6310 Pagemont Rd
- 6290 Pagemont Rd
- 6380 Pagemont Rd
- 6650 Dellwood Dr
- 1530 Buffalo St
- 1526 Buffalo St
- 242 Northcrest Dr
- 222 Northcrest Dr
- 185 Northcrest Dr
- 167 Northcrest Dr
- 210 Northcrest Dr
- 2505 Northcrest Dr
- 220 Ridgecrest Dr Unit 2
- 196 Northcrest Dr
- 184 Northcrest Dr
- 160 Northcrest Dr
- 306 Tanglewood Dr Unit 1
- 302 Tanglewood Dr
- 311 Tanglewood Dr
- 0 Wright Rd
- 0000 Wright Rd
- 0 Tanglewood Dr Unit CAR3921801
- 0 Tanglewood Dr Unit 1 3912611
- 0 Tanglewood Dr Unit CAR3841550
- 0 Tanglewood Dr Unit 3 3775490
- 0 Tanglewood Dr Unit 2 3775608
Your Personal Tour Guide
Ask me questions while you tour the home.