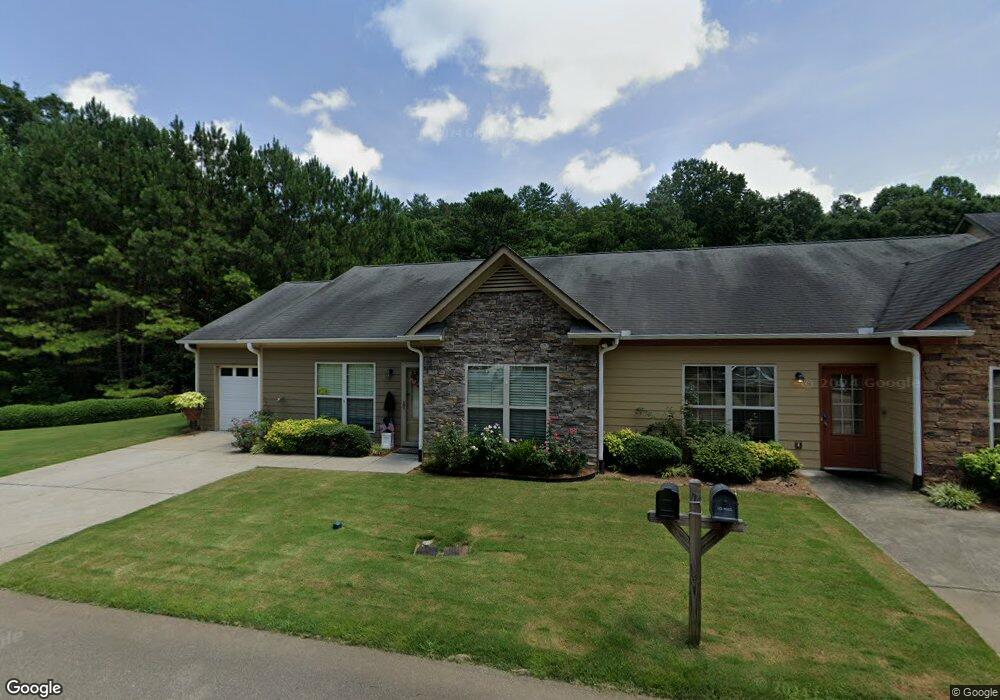
266 Ridgehaven Trail Unit 2 Ellijay, GA 30536
Estimated Value: $271,096 - $353,000
2
Beds
2
Baths
1,194
Sq Ft
$253/Sq Ft
Est. Value
About This Home
This home is located at 266 Ridgehaven Trail Unit 2, Ellijay, GA 30536 and is currently estimated at $302,024, approximately $252 per square foot. 266 Ridgehaven Trail Unit 2 is a home located in Gilmer County with nearby schools including Ellijay Elementary School, Clear Creek Elementary School, and Clear Creek Middle School.
Ownership History
Date
Name
Owned For
Owner Type
Purchase Details
Closed on
Feb 8, 2024
Sold by
Daniels Patricia Anne
Bought by
Daniels Patricia Anne Trust and Lykins Holly Shay Daniels Tr
Current Estimated Value
Purchase Details
Closed on
Sep 21, 2020
Sold by
Southern Catherine J
Bought by
Daniels Patrticia Anne
Purchase Details
Closed on
Mar 13, 2008
Sold by
Hidden Valley Homes Llc
Bought by
Southern Catherine J
Home Financials for this Owner
Home Financials are based on the most recent Mortgage that was taken out on this home.
Original Mortgage
$99,920
Interest Rate
5.68%
Mortgage Type
New Conventional
Purchase Details
Closed on
Oct 31, 2005
Sold by
Rbtm Llc
Bought by
Hidden Valley Development Llc
Create a Home Valuation Report for This Property
The Home Valuation Report is an in-depth analysis detailing your home's value as well as a comparison with similar homes in the area
Home Values in the Area
Average Home Value in this Area
Purchase History
| Date | Buyer | Sale Price | Title Company |
|---|---|---|---|
| Daniels Patricia Anne Trust | -- | -- | |
| Daniels Patrticia Anne | -- | -- | |
| Southern Catherine J | $124,900 | -- | |
| Hidden Valley Development Llc | $230,500 | -- |
Source: Public Records
Mortgage History
| Date | Status | Borrower | Loan Amount |
|---|---|---|---|
| Previous Owner | Southern Catherine J | $99,920 |
Source: Public Records
Tax History Compared to Growth
Tax History
| Year | Tax Paid | Tax Assessment Tax Assessment Total Assessment is a certain percentage of the fair market value that is determined by local assessors to be the total taxable value of land and additions on the property. | Land | Improvement |
|---|---|---|---|---|
| 2025 | $332 | $103,640 | $4,320 | $99,320 |
| 2024 | $332 | $106,520 | $8,600 | $97,920 |
| 2023 | $341 | $100,520 | $8,600 | $91,920 |
| 2022 | $355 | $78,040 | $8,600 | $69,440 |
| 2021 | $356 | $56,800 | $3,600 | $53,200 |
| 2020 | $404 | $55,600 | $9,000 | $46,600 |
| 2019 | $423 | $58,000 | $11,400 | $46,600 |
| 2018 | $328 | $58,000 | $11,400 | $46,600 |
| 2017 | $325 | $39,920 | $3,600 | $36,320 |
| 2016 | $964 | $40,280 | $3,600 | $36,680 |
| 2015 | $917 | $39,120 | $3,600 | $35,520 |
| 2014 | $933 | $38,520 | $3,600 | $34,920 |
| 2013 | -- | $39,240 | $3,600 | $35,640 |
Source: Public Records
Map
Nearby Homes
- LOT 3 Ridgehaven Trail
- Lots 1-3 Ridgehaven Trail
- 0 Yukon Rd Unit 10649657
- 216 Old Orchard Square
- 138.06AC Georgia 515
- 269 Old Orchard Rd
- 0 Aspen Ave Unit 10501189
- 0 Aspen Ave Unit 1025047
- 31 Willow St
- 71 Black Walnut Place
- LOT 17 Misty Mountain Trail
- 138.06 AC Georgia 515
- 0 Hill St
- 118 E Oak St
- 466 Hefner St
- 220 Oak Ridge Ln
- 0 Highway 52 W Unit 10598315
- 0 Highway 52 W Unit 7642027
- Lot 4 Mountain Trace
- Lot 4 Mountain Trace Unit 4
- 266 Ridgehaven Trail
- 252 Ridgehaven Trail
- BLDG 8 1, 2, 3 Ridgehaven Trail Unit BUILDING 8, UNITS 1,
- 250 Ridgehaven Trail
- 250 Ridgehaven Trail Unit 3
- 250 Ridgehaven Trail
- 263 Ridgehaven Trail Unit 2
- 263 Ridgehaven Trail
- 263 Ridgehaven Trail Unit 3, BLDG 6
- 235 Ridgehaven Trail
- 235 Ridgehaven Trail Unit 4
- 235 Ridgehaven Trail Unit 3
- 235 Ridgehaven Trail Unit 2
- 235 Ridgehaven Trail Unit 1
- 235-1 Ridgehaven Trail
- 222 Ridgehaven Trail Unit 4
- 222 Ridgehaven Trail Unit 3
- 222 Ridgehaven Trail Unit 2
- 222 Ridgehaven Trail Unit 1
- Bldg8 Ridgehaven Trail Unit Lot 3