Estimated Value: $281,478 - $339,000
Studio
--
Bath
--
Sq Ft
10,454
Sq Ft Lot
About This Home
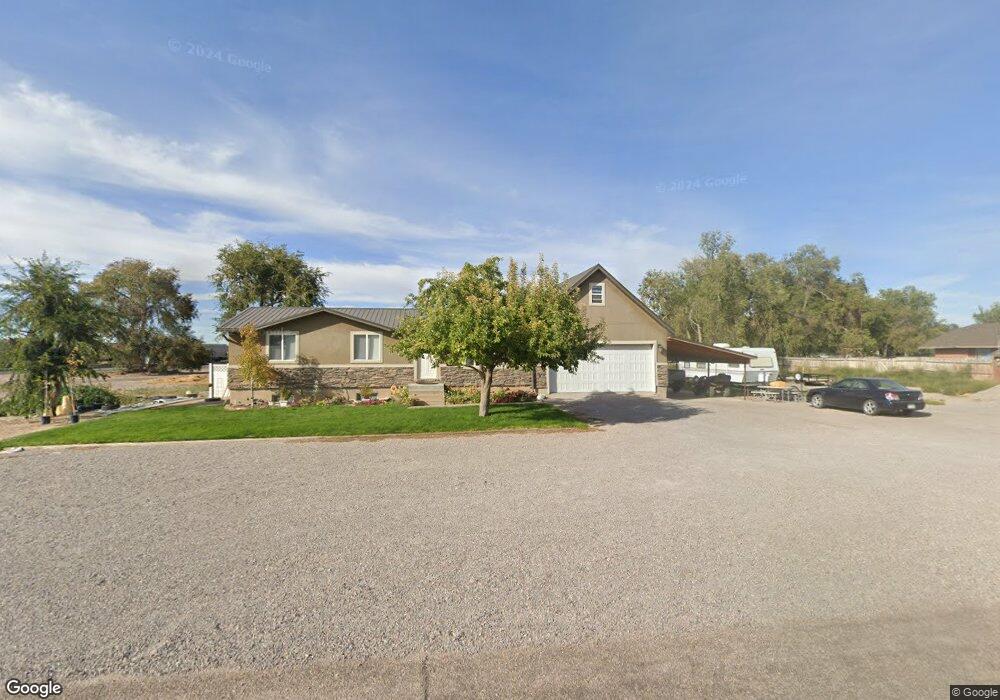
This home is located at 266 W 400 N, Delta, UT 84624 and is currently estimated at $309,620. 266 W 400 N is a home with nearby schools including Cba Center and White River Academy.
Ownership History
Date
Name
Owned For
Owner Type
Purchase Details
Closed on
Jan 20, 2021
Sold by
Nielson Cade and Nielson Linsey
Bought by
Nielson Linsey and Nielson Cade
Current Estimated Value
Home Financials for this Owner
Home Financials are based on the most recent Mortgage that was taken out on this home.
Original Mortgage
$76,500
Outstanding Balance
$68,277
Interest Rate
2.71%
Mortgage Type
New Conventional
Estimated Equity
$241,343
Purchase Details
Closed on
Oct 21, 2010
Sold by
Shields Laura E
Bought by
Nielson Cade and Nielson Linsey
Home Financials for this Owner
Home Financials are based on the most recent Mortgage that was taken out on this home.
Original Mortgage
$91,184
Interest Rate
4.33%
Mortgage Type
New Conventional
Create a Home Valuation Report for This Property
The Home Valuation Report is an in-depth analysis detailing your home's value as well as a comparison with similar homes in the area
Home Values in the Area
Average Home Value in this Area
Purchase History
| Date | Buyer | Sale Price | Title Company |
|---|---|---|---|
| Nielson Linsey | -- | First American Title | |
| Nielson Cade | -- | -- |
Source: Public Records
Mortgage History
| Date | Status | Borrower | Loan Amount |
|---|---|---|---|
| Open | Nielson Linsey | $76,500 | |
| Closed | Nielson Cade | $91,184 |
Source: Public Records
Tax History
| Year | Tax Paid | Tax Assessment Tax Assessment Total Assessment is a certain percentage of the fair market value that is determined by local assessors to be the total taxable value of land and additions on the property. | Land | Improvement |
|---|---|---|---|---|
| 2025 | $1,414 | $151,119 | $16,379 | $134,740 |
| 2024 | $1,414 | $122,249 | $8,225 | $114,024 |
| 2023 | $1,574 | $122,249 | $8,225 | $114,024 |
| 2022 | $1,148 | $86,337 | $7,477 | $78,860 |
| 2021 | $922 | $66,150 | $6,502 | $59,648 |
| 2020 | $858 | $61,209 | $5,911 | $55,298 |
| 2019 | $750 | $53,502 | $5,473 | $48,029 |
| 2018 | $632 | $45,420 | $5,473 | $39,947 |
| 2017 | $653 | $45,260 | $5,313 | $39,947 |
| 2016 | $632 | $45,260 | $5,313 | $39,947 |
| 2015 | $632 | $45,260 | $5,313 | $39,947 |
| 2014 | -- | $40,173 | $5,313 | $34,860 |
| 2013 | -- | $40,173 | $5,313 | $34,860 |
Source: Public Records
Map
Nearby Homes
- 325 N 100 W
- 451 W 300 N
- 98 W 1000 N
- 163 W 100 S
- 0 E Highway 6 Unit LotWP001 16586023
- 294 S 300 W
- 44 E 300 S
- 520 E 450 North Rd
- 445 Topaz Blvd Unit 10
- 7900 E 250 Rd N
- 87 S 300 East Rd
- 32 E 300 S
- 38 E 300 S
- 321 E 200 S
- 901 E 750 Rd N
- 628 Sunset St
- 9000 W 1500 Rd N
- Locust Ave Unit LotWP001
- 625 E Birch Dr
- 7430 W 3000 N