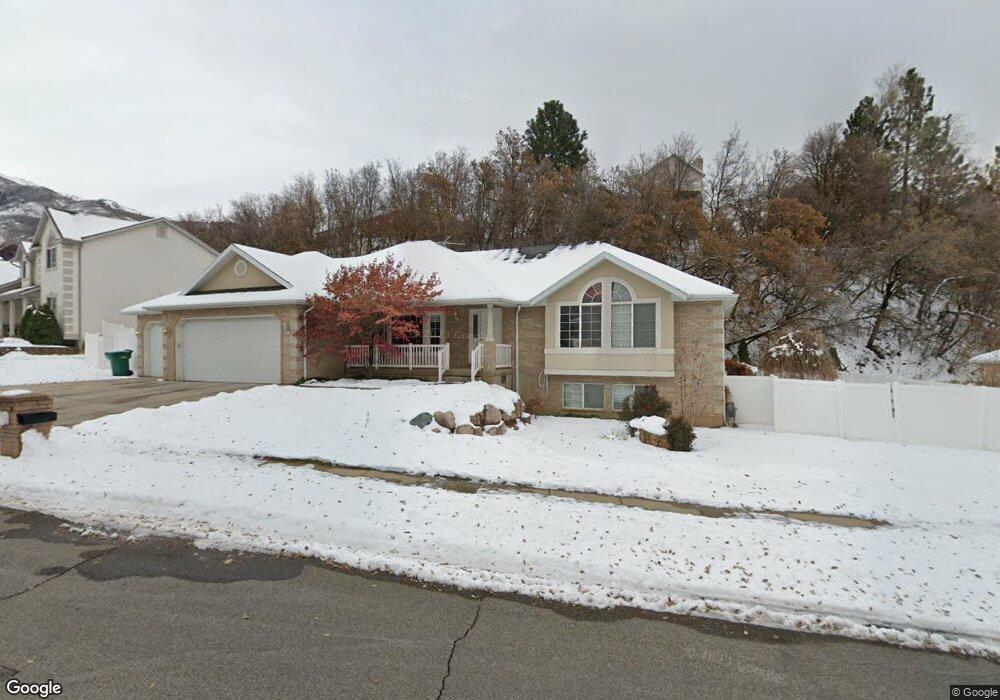
2660 E 1700 N Layton, UT 84040
Estimated Value: $666,000 - $766,000
5
Beds
4
Baths
4,021
Sq Ft
$177/Sq Ft
Est. Value
About This Home
This home is located at 2660 E 1700 N, Layton, UT 84040 and is currently estimated at $709,756, approximately $176 per square foot. 2660 E 1700 N is a home located in Davis County with nearby schools including East Layton Elementary School, Central Davis Junior High School, and Northridge High School.
Ownership History
Date
Name
Owned For
Owner Type
Purchase Details
Closed on
Jul 10, 2023
Sold by
Manning Jeremy and Manning Lisa
Bought by
Dunn Jared B and Dunn Mary Ann
Current Estimated Value
Purchase Details
Closed on
May 19, 2016
Sold by
Merrill Carol E
Bought by
Manning Jeremy and Manning Lisa
Purchase Details
Closed on
Apr 1, 1999
Sold by
Grein William L and Grein Judy K
Bought by
Merrill Carol E
Home Financials for this Owner
Home Financials are based on the most recent Mortgage that was taken out on this home.
Original Mortgage
$140,000
Interest Rate
7.04%
Purchase Details
Closed on
Jun 18, 1996
Sold by
Lessig Construction
Bought by
Grein William L and Grein Judy K
Home Financials for this Owner
Home Financials are based on the most recent Mortgage that was taken out on this home.
Original Mortgage
$207,000
Interest Rate
8.25%
Create a Home Valuation Report for This Property
The Home Valuation Report is an in-depth analysis detailing your home's value as well as a comparison with similar homes in the area
Home Values in the Area
Average Home Value in this Area
Purchase History
| Date | Buyer | Sale Price | Title Company |
|---|---|---|---|
| Dunn Jared B | -- | Old Republic Title | |
| Manning Jeremy | -- | Mountain Title | |
| Merrill Carol E | -- | Associated Title Company | |
| Grein William L | -- | Us Title |
Source: Public Records
Mortgage History
| Date | Status | Borrower | Loan Amount |
|---|---|---|---|
| Previous Owner | Merrill Carol E | $140,000 | |
| Previous Owner | Grein William L | $207,000 |
Source: Public Records
Tax History
| Year | Tax Paid | Tax Assessment Tax Assessment Total Assessment is a certain percentage of the fair market value that is determined by local assessors to be the total taxable value of land and additions on the property. | Land | Improvement |
|---|---|---|---|---|
| 2025 | $3,264 | $342,650 | $141,383 | $201,267 |
| 2024 | $3,116 | $329,450 | $162,017 | $167,433 |
| 2023 | $3,192 | $595,000 | $211,955 | $383,045 |
| 2022 | $3,380 | $342,100 | $114,256 | $227,844 |
| 2021 | $3,120 | $471,000 | $174,793 | $296,207 |
| 2020 | $2,845 | $434,000 | $145,183 | $288,817 |
| 2019 | $2,933 | $416,000 | $128,897 | $287,103 |
| 2018 | $2,725 | $388,000 | $103,232 | $284,768 |
| 2016 | $2,646 | $194,370 | $68,891 | $125,479 |
| 2015 | $2,541 | $177,210 | $68,891 | $108,319 |
| 2014 | $2,251 | $160,476 | $68,891 | $91,585 |
| 2013 | -- | $159,898 | $38,806 | $121,092 |
Source: Public Records
Map
Nearby Homes
- 2391 Kays Creek Dr
- 2547 E 1900 N
- 2509 E 1900 N
- 1954 N 2600 E
- 1752 N Valley View Dr
- 2231 N Valley View Dr
- 1870 N Valley View Dr Unit 201
- 1332 N 2350 E
- 1907 N Bridge Ct
- 2136 N 2800 E
- 2124 E Cherry Ln
- 1960 N 2150 E
- 2203 E 1200 N
- 2563 E 2250 N
- 2855 E Gentile St Unit 1
- 1975 E 1425 N
- 2113 E 1200 N
- 1843 Hayes Dr
- 2340 N 2050 E
- 2273 N 1975 E
Your Personal Tour Guide
Ask me questions while you tour the home.