Estimated Value: $144,000 - $213,000
3
Beds
2
Baths
1,008
Sq Ft
$174/Sq Ft
Est. Value
About This Home
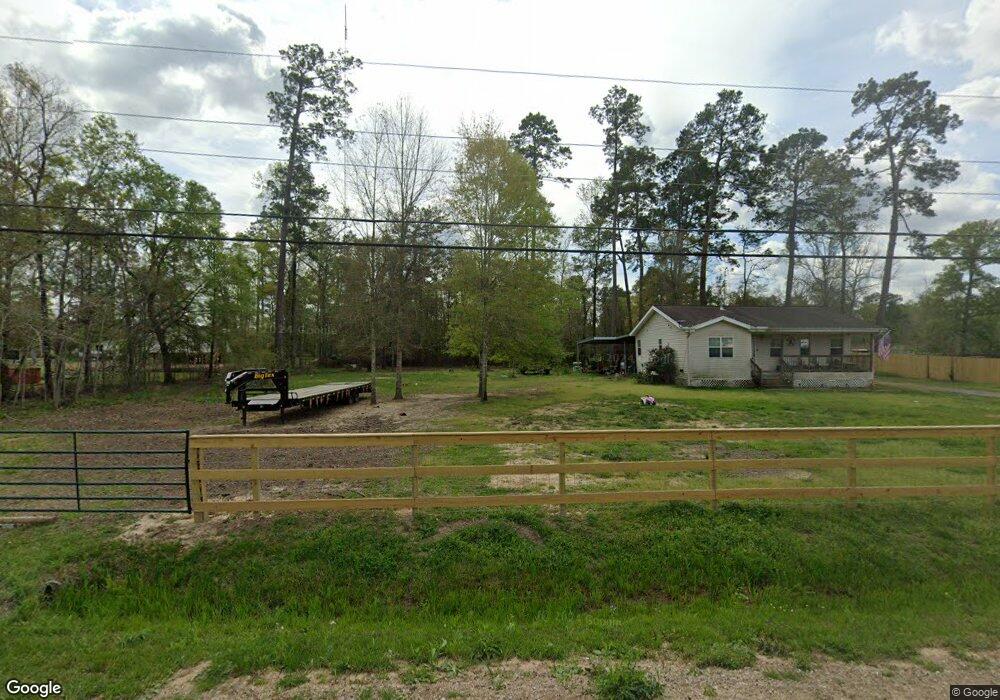
This home is located at 2660 Roosevelt St, Vidor, TX 77662 and is currently estimated at $175,569, approximately $174 per square foot. 2660 Roosevelt St is a home located in Orange County with nearby schools including Faith Christian Academy.
Ownership History
Date
Name
Owned For
Owner Type
Purchase Details
Closed on
Jun 14, 2021
Sold by
Gillespie Steven Wayne and Gillespie Alisa
Bought by
Foss Julia and Foss Dustin
Current Estimated Value
Home Financials for this Owner
Home Financials are based on the most recent Mortgage that was taken out on this home.
Original Mortgage
$122,244
Outstanding Balance
$110,435
Interest Rate
2.9%
Mortgage Type
FHA
Estimated Equity
$65,134
Purchase Details
Closed on
Jan 30, 2013
Sold by
Valvoda David J and Valvoda Kathleen
Bought by
Gillespie Steven Wayne
Home Financials for this Owner
Home Financials are based on the most recent Mortgage that was taken out on this home.
Original Mortgage
$82,968
Interest Rate
3.42%
Mortgage Type
FHA
Purchase Details
Closed on
Mar 8, 2007
Sold by
Stowell Karen
Bought by
Valvoda David J and Valvoda Kathleen
Create a Home Valuation Report for This Property
The Home Valuation Report is an in-depth analysis detailing your home's value as well as a comparison with similar homes in the area
Home Values in the Area
Average Home Value in this Area
Purchase History
| Date | Buyer | Sale Price | Title Company |
|---|---|---|---|
| Foss Julia | -- | Capital Title | |
| Gillespie Steven Wayne | -- | None Available | |
| Valvoda David J | -- | Stc | |
| Gillespie Steven Wayne | -- | -- |
Source: Public Records
Mortgage History
| Date | Status | Borrower | Loan Amount |
|---|---|---|---|
| Open | Foss Julia | $122,244 | |
| Previous Owner | Gillespie Steven Wayne | $82,968 |
Source: Public Records
Tax History Compared to Growth
Tax History
| Year | Tax Paid | Tax Assessment Tax Assessment Total Assessment is a certain percentage of the fair market value that is determined by local assessors to be the total taxable value of land and additions on the property. | Land | Improvement |
|---|---|---|---|---|
| 2025 | $4,259 | $172,163 | $40,940 | $131,223 |
| 2024 | $2,603 | $172,356 | $40,940 | $131,416 |
| 2023 | $3,730 | $157,783 | $11,500 | $146,283 |
| 2022 | $2,777 | $134,020 | $11,500 | $122,520 |
| 2021 | $3,547 | $118,800 | $11,500 | $107,300 |
| 2020 | $3,407 | $112,180 | $11,500 | $100,680 |
| 2019 | $3,245 | $105,800 | $11,500 | $94,300 |
| 2018 | $3,032 | $101,280 | $11,500 | $89,780 |
| 2017 | $2,333 | $101,280 | $11,500 | $89,780 |
| 2016 | $2,796 | $92,470 | $11,500 | $80,970 |
| 2015 | $2,056 | $83,822 | $11,500 | $72,322 |
| 2014 | $2,056 | $83,897 | $11,500 | $72,397 |
Source: Public Records
Map
Nearby Homes
- 2665 Lincoln St
- 0 School Rd
- 2950 Old Highway 90 E
- 835 Strickland St
- 2890 Evangeline Dr
- 1560 Posey Ln
- 250 Oakland Dr
- tbd Oakland St
- 305 Oakland Dr
- 235 Jennings Rd
- 000 Hwy 1132
- 285 Lakewood Dr
- 605 N Lakeside St
- 18046 Interstate 10
- 120 Lawrence Ln
- 18185 Ih 10
- 425 Lawrence Ln
- 220 Delores St
- 2950 Highway 90
- 955 Aery Rd
- 2650 Roosevelt St
- 2600 Roosevelt St
- 2655 E Railroad St
- 195 Freeway Dr
- 2655 Roosevelt St
- 2625 E Railroad St
- 2675 E Railroad St
- 2570 Roosevelt St
- 2675 Roosevelt St Unit 2 lots
- TBD Roosevelt St
- 2555 Roosevelt St
- 2675 Lincoln St
- 2680 Lincoln St
- 2575 E Railroad St
- 190 Freeway Dr
- 2630 Lincoln St
- 295 Freeway Dr
- 210 Freeway Dr
- 2550 Roosevelt St
- 2555 E Railroad St