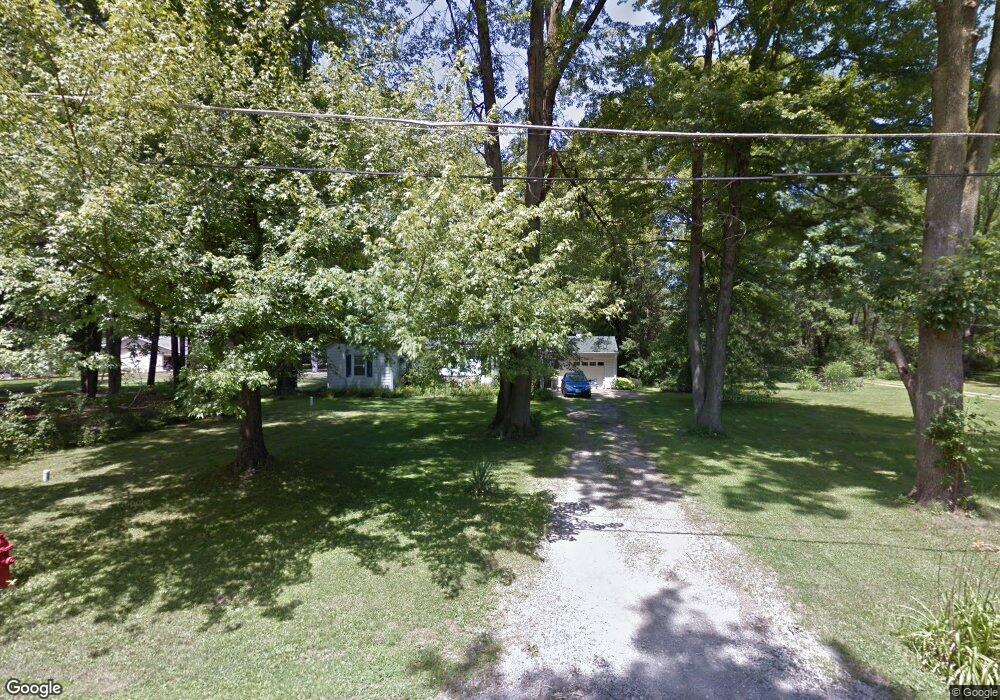
26600 Cranage Rd Olmsted Falls, OH 44138
Estimated Value: $227,551 - $272,000
3
Beds
2
Baths
1,372
Sq Ft
$179/Sq Ft
Est. Value
About This Home
This home is located at 26600 Cranage Rd, Olmsted Falls, OH 44138 and is currently estimated at $245,138, approximately $178 per square foot. 26600 Cranage Rd is a home located in Cuyahoga County with nearby schools including Falls-Lenox Primary Elementary School, Olmsted Falls Intermediate Building, and Olmsted Falls Middle School.
Ownership History
Date
Name
Owned For
Owner Type
Purchase Details
Closed on
Feb 10, 2020
Sold by
Gray Gordon W and Gray Christine M
Bought by
Gray Gordon W and Gray Marion Christine
Current Estimated Value
Purchase Details
Closed on
Aug 1, 2000
Sold by
Gray Gordon W
Bought by
Gray Gordon W
Purchase Details
Closed on
Dec 12, 1994
Sold by
Blaircum Alice Marie Van
Bought by
Gray Gray M and Gray Gordon W
Home Financials for this Owner
Home Financials are based on the most recent Mortgage that was taken out on this home.
Original Mortgage
$96,626
Interest Rate
9.06%
Mortgage Type
FHA
Purchase Details
Closed on
Jun 9, 1992
Sold by
Vanblaircum Bennie
Bought by
Vanblaircum Alice Marie
Purchase Details
Closed on
Feb 10, 1982
Sold by
Vanblaircum Bennie and Vanblaircum Alice
Bought by
Vanblaircum Bennie
Purchase Details
Closed on
Jan 1, 1975
Bought by
Vanblaircum Bennie and Vanblaircum Alice
Create a Home Valuation Report for This Property
The Home Valuation Report is an in-depth analysis detailing your home's value as well as a comparison with similar homes in the area
Home Values in the Area
Average Home Value in this Area
Purchase History
| Date | Buyer | Sale Price | Title Company |
|---|---|---|---|
| Gray Gordon W | -- | None Available | |
| Gray Gordon W | -- | -- | |
| Gray Gray M | $105,000 | -- | |
| Vanblaircum Alice Marie | -- | -- | |
| Vanblaircum Bennie | -- | -- | |
| Vanblaircum Bennie | -- | -- |
Source: Public Records
Mortgage History
| Date | Status | Borrower | Loan Amount |
|---|---|---|---|
| Closed | Gray Gray M | $96,626 |
Source: Public Records
Tax History Compared to Growth
Tax History
| Year | Tax Paid | Tax Assessment Tax Assessment Total Assessment is a certain percentage of the fair market value that is determined by local assessors to be the total taxable value of land and additions on the property. | Land | Improvement |
|---|---|---|---|---|
| 2024 | $4,735 | $62,755 | $15,540 | $47,215 |
| 2023 | $4,653 | $50,580 | $14,560 | $36,020 |
| 2022 | $4,618 | $50,580 | $14,560 | $36,020 |
| 2021 | $4,012 | $50,580 | $14,560 | $36,020 |
| 2020 | $4,040 | $44,380 | $12,780 | $31,610 |
| 2019 | $3,598 | $126,800 | $36,500 | $90,300 |
| 2018 | $3,625 | $44,380 | $12,780 | $31,610 |
| 2017 | $3,629 | $41,440 | $11,060 | $30,380 |
| 2016 | $3,610 | $41,440 | $11,060 | $30,380 |
| 2015 | $3,439 | $41,440 | $11,060 | $30,380 |
| 2014 | $3,439 | $38,370 | $10,260 | $28,110 |
Source: Public Records
Map
Nearby Homes
- 11 Concert Ct
- 3 Concert Ln
- 3 Fiddle Sticks
- 16 Van Ess Dr
- 20 Van Ess Dr
- 25725 Cook Rd
- 25950 Bagley Rd
- 7224 Pine Woods Way
- 29 Carl Ln
- 5 Hawthorn Dr
- 11 Brookins Dr
- V/L Columbia Rd
- 55 Patio Ln
- 7593 Columbia Rd
- 3 Dogwood Ln
- 7296 Chestnut Ct
- 26788 Skyline Dr
- 281-12-024 River Rd
- 281-12-007 River Rd
- 7030 Columbia Rd
- 26580 Cranage Rd
- 26644 Cranage Rd
- 26550 Cranage Rd
- 7652 Inland Dr
- 7662 Inland Dr
- 26603 Cranage Rd
- 26682 Cranage Rd
- 7642 Inland Dr
- 26520 Cranage Rd
- 7661 Inland Dr
- 26549 Cranage Rd
- 26692 Cranage Rd
- 7632 Inland Dr
- 7651 Inland Dr
- 26681 Cranage Rd
- 26712 Cranage Rd
- 26490 Cranage Rd
- 7622 Inland Dr
- 7641 Inland Dr
- 26513 Cranage Rd