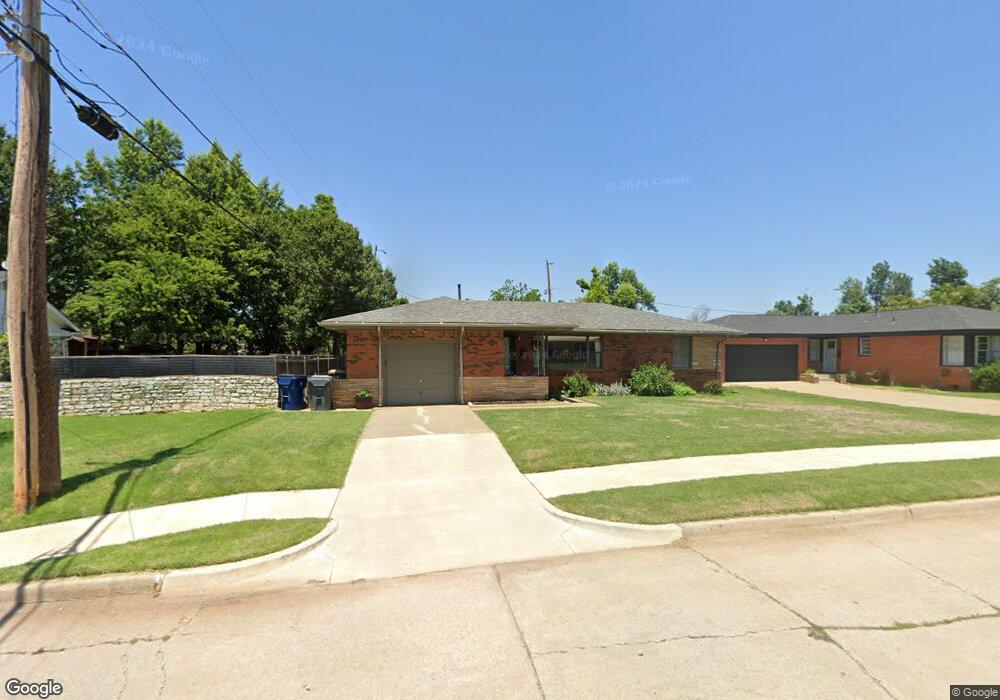
2661 Lakeside Dr Oklahoma City, OK 73120
Estimated Value: $191,000 - $214,000
3
Beds
1
Bath
1,214
Sq Ft
$169/Sq Ft
Est. Value
About This Home
This home is located at 2661 Lakeside Dr, Oklahoma City, OK 73120 and is currently estimated at $204,970, approximately $168 per square foot. 2661 Lakeside Dr is a home located in Oklahoma County with nearby schools including Ridgeview Elementary School, John Marshall Enterprise Middle School, and John Marshall Enterprise High School.
Ownership History
Date
Name
Owned For
Owner Type
Purchase Details
Closed on
Aug 27, 2020
Sold by
Maguire Shawn L and Maguire Tanda
Bought by
Hollrah Kasie L
Current Estimated Value
Home Financials for this Owner
Home Financials are based on the most recent Mortgage that was taken out on this home.
Original Mortgage
$155,800
Outstanding Balance
$138,516
Interest Rate
3%
Mortgage Type
New Conventional
Estimated Equity
$66,454
Purchase Details
Closed on
May 2, 2016
Sold by
Mccoy Kimberly B
Bought by
Maguire Shawn L
Purchase Details
Closed on
Dec 23, 2010
Sold by
Swaim Judy A and Swaim James M
Bought by
Mccoy Kimberley B
Home Financials for this Owner
Home Financials are based on the most recent Mortgage that was taken out on this home.
Original Mortgage
$113,059
Interest Rate
4.4%
Mortgage Type
FHA
Create a Home Valuation Report for This Property
The Home Valuation Report is an in-depth analysis detailing your home's value as well as a comparison with similar homes in the area
Home Values in the Area
Average Home Value in this Area
Purchase History
| Date | Buyer | Sale Price | Title Company |
|---|---|---|---|
| Hollrah Kasie L | $164,000 | Oklahoma City Abstract & Ttl | |
| Maguire Shawn L | $88,500 | Attorney | |
| Mccoy Kimberley B | $116,000 | Stewart Abstract & Title Of |
Source: Public Records
Mortgage History
| Date | Status | Borrower | Loan Amount |
|---|---|---|---|
| Open | Hollrah Kasie L | $155,800 | |
| Previous Owner | Mccoy Kimberley B | $113,059 |
Source: Public Records
Tax History Compared to Growth
Tax History
| Year | Tax Paid | Tax Assessment Tax Assessment Total Assessment is a certain percentage of the fair market value that is determined by local assessors to be the total taxable value of land and additions on the property. | Land | Improvement |
|---|---|---|---|---|
| 2024 | $2,073 | $18,810 | $2,817 | $15,993 |
| 2023 | $2,073 | $18,262 | $2,798 | $15,464 |
| 2022 | $1,928 | $17,731 | $2,467 | $15,264 |
| 2021 | $1,814 | $17,215 | $2,547 | $14,668 |
| 2020 | $1,462 | $13,255 | $2,547 | $10,708 |
| 2019 | $1,414 | $12,762 | $2,473 | $10,289 |
| 2018 | $1,278 | $12,155 | $0 | $0 |
| 2017 | $1,208 | $12,319 | $2,115 | $10,204 |
| 2016 | $1,161 | $11,769 | $2,115 | $9,654 |
| 2015 | $1,115 | $11,273 | $2,115 | $9,158 |
| 2014 | $1,131 | $11,496 | $2,464 | $9,032 |
Source: Public Records
Map
Nearby Homes
- 10508 Whitehaven Rd
- 2604 Keats Place
- 10512 Ridgeview Dr
- 2604 Kings Way
- 2609 Huntleigh Dr
- 2716 Tottingham Rd
- 2413 Milano Ln
- 9800 Mahler Place
- 2409 Sorrento Dr
- 2924 Lakeside Dr
- 2455 Manchester Dr Unit 57
- 2455 Manchester Dr Unit 8
- 2455 Manchester Dr Unit 16
- 2601 Chaucer Dr
- 2912 Carlton Way
- 10405 Major Ave
- 2429 Barclay Rd
- 2512 Ashley Dr
- 3009 Kent Dr
- 9412 Britton Cir
- 2657 Lakeside Dr
- 2656 Manchester Dr
- 10200 Sunnymeade Place
- 10204 Sunnymeade Place
- 2653 Lakeside Dr
- 2652 Manchester Dr
- 10208 Sunnymeade Place
- 2664 Lakeside Dr
- 2648 Manchester Dr
- 2649 Lakeside Dr
- 2656 Lakeside Dr
- 10104 Sunnymeade Place
- 2652 Lakeside Dr
- 2644 Manchester Dr
- 2645 Lakeside Dr
- 10301 Whitehaven Rd
- 10300 Sunnymeade Place
- 2648 Lakeside Dr
- 10201 Sunnymeade Place
- 2640 Manchester Dr