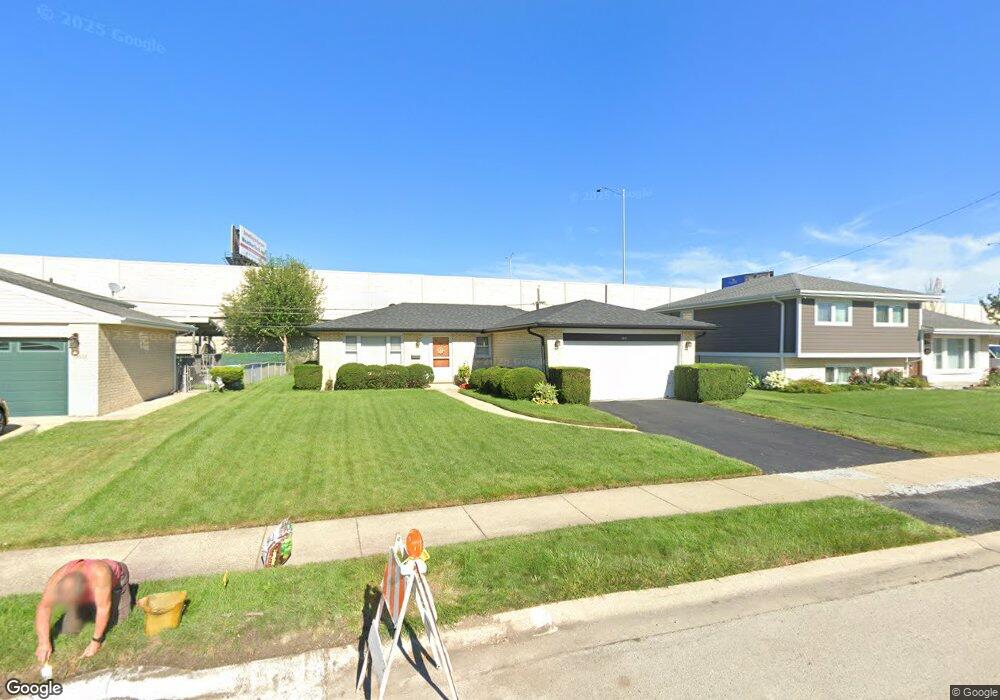
2661 Rusty Dr Des Plaines, IL 60018
Estimated Value: $367,000 - $433,000
3
Beds
2
Baths
1,197
Sq Ft
$327/Sq Ft
Est. Value
About This Home
This home is located at 2661 Rusty Dr, Des Plaines, IL 60018 and is currently estimated at $391,737, approximately $327 per square foot. 2661 Rusty Dr is a home located in Cook County with nearby schools including Orchard Place Elementary School, Algonquin Middle School, and Maine West High School.
Create a Home Valuation Report for This Property
The Home Valuation Report is an in-depth analysis detailing your home's value as well as a comparison with similar homes in the area
Home Values in the Area
Average Home Value in this Area
Tax History
| Year | Tax Paid | Tax Assessment Tax Assessment Total Assessment is a certain percentage of the fair market value that is determined by local assessors to be the total taxable value of land and additions on the property. | Land | Improvement |
|---|---|---|---|---|
| 2025 | $7,035 | $33,000 | $6,201 | $26,799 |
| 2024 | $7,035 | $30,001 | $5,168 | $24,833 |
| 2023 | $6,839 | $30,001 | $5,168 | $24,833 |
| 2022 | $6,839 | $30,001 | $5,168 | $24,833 |
| 2021 | $7,305 | $27,096 | $4,306 | $22,790 |
| 2020 | $7,251 | $27,096 | $4,306 | $22,790 |
| 2019 | $7,271 | $30,446 | $4,306 | $26,140 |
| 2018 | $5,788 | $22,789 | $3,789 | $19,000 |
| 2017 | $5,703 | $22,789 | $3,789 | $19,000 |
| 2016 | $5,639 | $22,789 | $3,789 | $19,000 |
| 2015 | $5,727 | $21,568 | $3,272 | $18,296 |
| 2014 | $5,623 | $21,568 | $3,272 | $18,296 |
| 2013 | $5,465 | $21,568 | $3,272 | $18,296 |
Source: Public Records
Map
Nearby Homes
- 2469 Parkwood Ln
- 2600 S Scott St
- 38 E Touhy Ave
- 2609 Eisenhower Dr
- 2945 S Scott St
- 300 Thames Pkwy Unit 3D
- 500 Thames Pkwy Unit 3G
- 500 Thames Pkwy Unit 1F
- 2646 Maple St
- 2993 Curtis St Unit 13
- 2500 Archbury Ln Unit 1A
- 201 Thames Pkwy Unit 2F
- 201 Thames Pkwy Unit 2K
- 1757 Farwell Ave
- 400 Ascot Dr Unit 1E
- 2035 Fargo Ave
- 2460 W Talcott Rd Unit 219
- 414 S Dee Rd Unit 13
- 2300 W Talcott Rd Unit 1A1
- 2300 W Talcott Rd Unit 1D
Your Personal Tour Guide
Ask me questions while you tour the home.