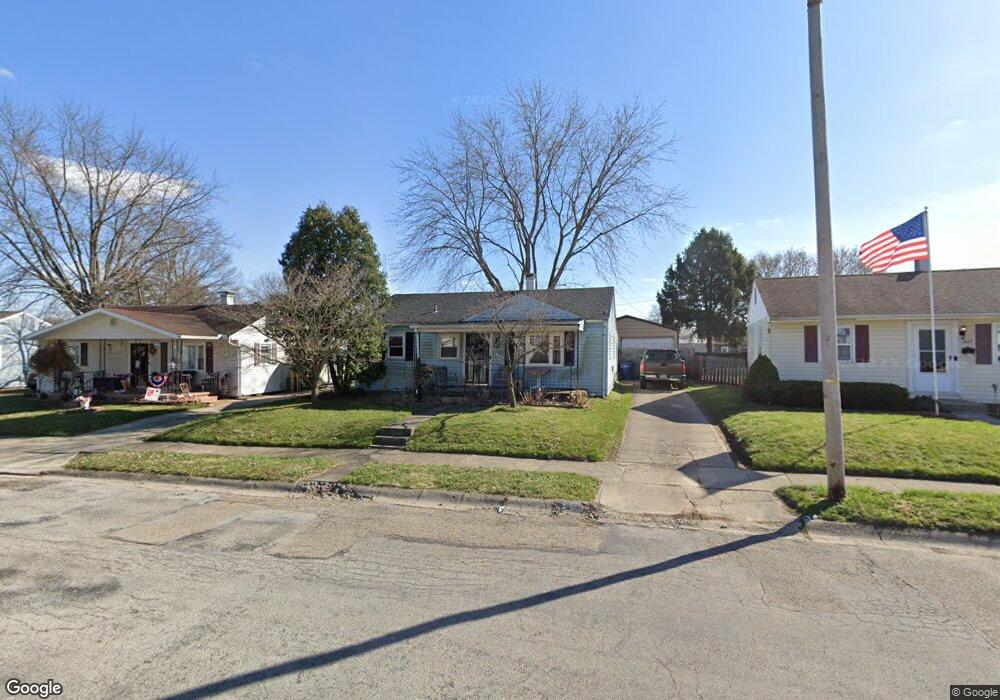
2663 Allen Dr Springfield, OH 45505
Estimated Value: $148,000 - $162,000
3
Beds
1
Bath
1,156
Sq Ft
$133/Sq Ft
Est. Value
About This Home
This home is located at 2663 Allen Dr, Springfield, OH 45505 and is currently estimated at $153,569, approximately $132 per square foot. 2663 Allen Dr is a home located in Clark County with nearby schools including Mann Elementary School, Schaefer Middle School, and Springfield High School.
Ownership History
Date
Name
Owned For
Owner Type
Purchase Details
Closed on
Mar 18, 2005
Sold by
Merriman Mark A and Merriman Amy E
Bought by
Sagraves Scott A
Current Estimated Value
Home Financials for this Owner
Home Financials are based on the most recent Mortgage that was taken out on this home.
Original Mortgage
$78,539
Outstanding Balance
$39,175
Interest Rate
5.67%
Mortgage Type
FHA
Estimated Equity
$114,394
Purchase Details
Closed on
Nov 28, 2000
Sold by
Brougher Robert I
Bought by
Merriman Mark A and Merriman Amy E
Home Financials for this Owner
Home Financials are based on the most recent Mortgage that was taken out on this home.
Original Mortgage
$61,100
Interest Rate
10.25%
Mortgage Type
Purchase Money Mortgage
Purchase Details
Closed on
Nov 21, 2000
Sold by
Brougher Don S
Bought by
Brougher Robert L
Home Financials for this Owner
Home Financials are based on the most recent Mortgage that was taken out on this home.
Original Mortgage
$61,100
Interest Rate
10.25%
Mortgage Type
Purchase Money Mortgage
Create a Home Valuation Report for This Property
The Home Valuation Report is an in-depth analysis detailing your home's value as well as a comparison with similar homes in the area
Home Values in the Area
Average Home Value in this Area
Purchase History
| Date | Buyer | Sale Price | Title Company |
|---|---|---|---|
| Sagraves Scott A | $72,200 | -- | |
| Merriman Mark A | $71,900 | -- | |
| Brougher Robert L | -- | -- |
Source: Public Records
Mortgage History
| Date | Status | Borrower | Loan Amount |
|---|---|---|---|
| Open | Sagraves Scott A | $78,539 | |
| Previous Owner | Merriman Mark A | $61,100 |
Source: Public Records
Tax History
| Year | Tax Paid | Tax Assessment Tax Assessment Total Assessment is a certain percentage of the fair market value that is determined by local assessors to be the total taxable value of land and additions on the property. | Land | Improvement |
|---|---|---|---|---|
| 2025 | $1,950 | $41,730 | $5,350 | $36,380 |
| 2024 | $1,452 | $30,120 | $5,010 | $25,110 |
| 2023 | $1,452 | $30,120 | $5,010 | $25,110 |
| 2022 | $1,487 | $30,120 | $5,010 | $25,110 |
| 2021 | $1,260 | $23,560 | $3,440 | $20,120 |
| 2020 | $1,263 | $23,560 | $3,440 | $20,120 |
| 2019 | $1,266 | $23,560 | $3,440 | $20,120 |
| 2018 | $1,175 | $20,980 | $2,870 | $18,110 |
| 2017 | $1,041 | $20,283 | $2,867 | $17,416 |
| 2016 | $1,042 | $20,283 | $2,867 | $17,416 |
| 2015 | $1,040 | $19,643 | $2,867 | $16,776 |
| 2014 | $1,036 | $19,643 | $2,867 | $16,776 |
| 2013 | $1,025 | $19,643 | $2,867 | $16,776 |
Source: Public Records
Map
Nearby Homes
- 1011 Mount Joy St
- 2670 Duncan St
- 2560 Kenton St
- 2804 Lowman St
- 2338 Dellwood Dr
- 360 Buxton Ave
- 374 Raffensperger Ave
- 400 S Arlington Ave Unit 402
- 2108 Sunset Ave
- 3154 Sherwood Park Dr
- 3012 E High St
- 2425 Kenilworth Ave
- 273 S Clairmont Ave
- 138 Lawnview Ave
- 1714 Kenton St
- 1823 Rutland Ave
- 115 S Burnett Rd
- 2040 N Hadley Rd
- 1724 S Belmont Ave
- 1652 Kenton St
Your Personal Tour Guide
Ask me questions while you tour the home.