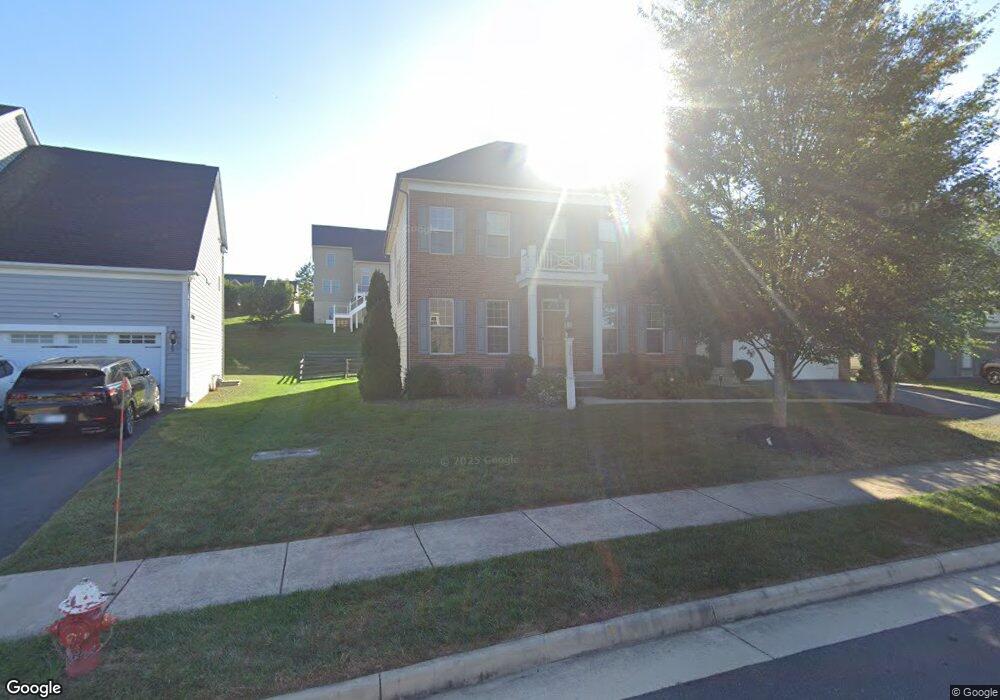
26632 Marbury Estates Dr Chantilly, VA 20152
Estimated Value: $1,283,000 - $1,322,000
6
Beds
5
Baths
5,167
Sq Ft
$253/Sq Ft
Est. Value
About This Home
This home is located at 26632 Marbury Estates Dr, Chantilly, VA 20152 and is currently estimated at $1,308,951, approximately $253 per square foot. 26632 Marbury Estates Dr is a home located in Loudoun County with nearby schools including Buffalo Trail Elementary School, Willard Middle School, and Lightridge High School.
Ownership History
Date
Name
Owned For
Owner Type
Purchase Details
Closed on
Dec 28, 2018
Sold by
Maiwand Harris and Shoecore Neelab
Bought by
Yellapantula Sai Shweta and Pragada Kalyan
Current Estimated Value
Home Financials for this Owner
Home Financials are based on the most recent Mortgage that was taken out on this home.
Original Mortgage
$508,199
Outstanding Balance
$448,606
Interest Rate
4.8%
Mortgage Type
New Conventional
Estimated Equity
$860,345
Purchase Details
Closed on
Feb 10, 2016
Sold by
Miller And Smith At Marbury Llc A Virgin
Bought by
Maiwand Harris and Shoecore Neelab
Home Financials for this Owner
Home Financials are based on the most recent Mortgage that was taken out on this home.
Original Mortgage
$636,446
Interest Rate
3.75%
Mortgage Type
FHA
Create a Home Valuation Report for This Property
The Home Valuation Report is an in-depth analysis detailing your home's value as well as a comparison with similar homes in the area
Home Values in the Area
Average Home Value in this Area
Purchase History
| Date | Buyer | Sale Price | Title Company |
|---|---|---|---|
| Yellapantula Sai Shweta | $726,000 | Apex Settlement Corporation | |
| Maiwand Harris | $665,000 | Hallmark Title Inc |
Source: Public Records
Mortgage History
| Date | Status | Borrower | Loan Amount |
|---|---|---|---|
| Open | Yellapantula Sai Shweta | $508,199 | |
| Previous Owner | Maiwand Harris | $636,446 |
Source: Public Records
Tax History Compared to Growth
Tax History
| Year | Tax Paid | Tax Assessment Tax Assessment Total Assessment is a certain percentage of the fair market value that is determined by local assessors to be the total taxable value of land and additions on the property. | Land | Improvement |
|---|---|---|---|---|
| 2025 | $9,553 | $1,186,710 | $375,600 | $811,110 |
| 2024 | $9,863 | $1,140,260 | $375,600 | $764,660 |
| 2023 | $9,704 | $1,109,040 | $375,600 | $733,440 |
| 2022 | $8,684 | $975,760 | $295,600 | $680,160 |
| 2021 | $8,161 | $832,710 | $260,600 | $572,110 |
| 2020 | $7,761 | $749,840 | $240,600 | $509,240 |
| 2019 | $7,675 | $734,490 | $240,600 | $493,890 |
| 2018 | $7,756 | $714,800 | $230,600 | $484,200 |
| 2017 | $8,042 | $714,800 | $230,600 | $484,200 |
| 2016 | $8,127 | $709,800 | $0 | $0 |
| 2015 | $2,561 | $0 | $0 | $0 |
| 2014 | $2,259 | $0 | $0 | $0 |
Source: Public Records
Map
Nearby Homes
- 0 Marbury Estates Dr Unit VALO2095034
- 42549 Fawn Meadow Place
- 42804 Appaloosa Trail Ct
- 41880 Hayfield Orchard Way
- 41854 Juniper Hill Ct
- 25771 Double Bridle Terrace
- 0 Braddock Rd Unit VALO2086014
- 25705 Clairmont Manor Square
- 25685 Arborshade Pass Place
- 42294 Iron Bit Place
- 0 Ambrose Tree Place
- Sullivan 31-F2 Plan at South 620 - Single Family Home
- Vesper 34-F2 Plan at South 620 - Villa
- Vida 34-F2 Plan at South 620 - Villa
- Sasha 31-F2 Plan at P2 at South 620
- 25648 Red Cherry Dr
- 41992 Holder Hill Ct
- 25857 Kirkwood Square
- 25623 Red Cherry Dr
- 42276 Magistrate Ct
- 26632 Marbury Estates Dr
- 26636 Marbury Estates Dr
- 40247 Marbury Estates Dr
- 26628 Marbury Estates Dr Unit LOT 54
- 26628 Marbury Estates Dr
- 26591 Vanderview Place
- 26595 Vanderview Place
- 26633 Marbury Estates Dr
- 26633 Marbury Estates Dr
- 26587 Vanderview Place
- 26640 Marbury Estates Dr
- 26624 Marbury Estates Dr
- 26599 Vanderview Place
- 26625 Marbury Estates Dr
- 26583 Vanderview Place
- 26620 Marbury Estates Dr
- 26620 Marbury Estates Dr
- 26629 Marbury Estates Dr
- 26621 Marbury Estates Dr
- 26621 Marbury Estates Dr