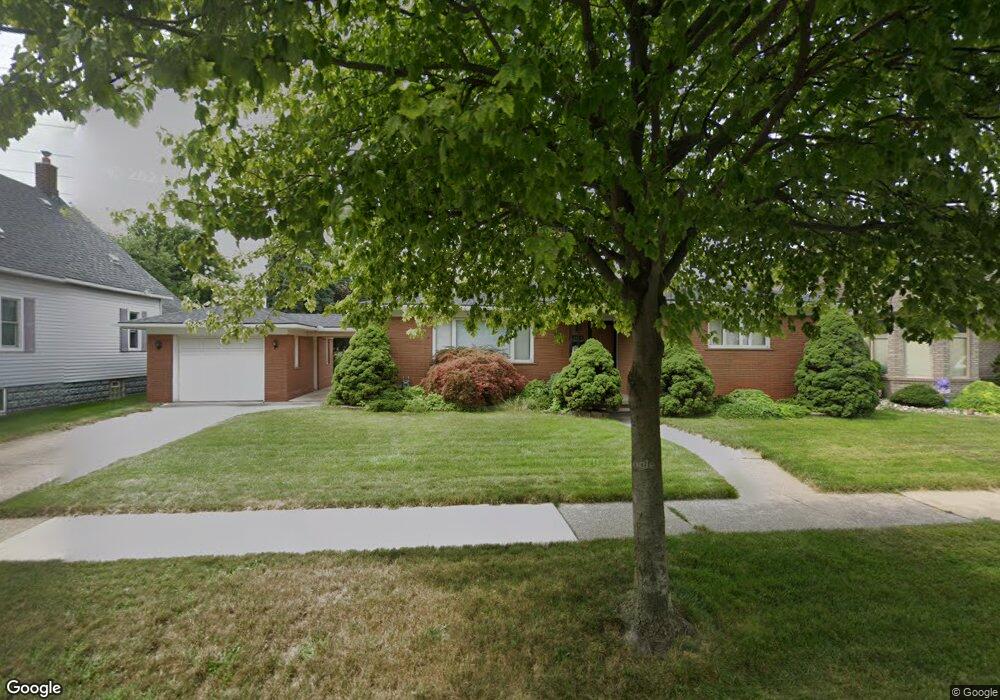
2664 9th St Wyandotte, MI 48192
Estimated Value: $218,000 - $263,000
2
Beds
2
Baths
1,300
Sq Ft
$181/Sq Ft
Est. Value
About This Home
This home is located at 2664 9th St, Wyandotte, MI 48192 and is currently estimated at $235,430, approximately $181 per square foot. 2664 9th St is a home located in Wayne County with nearby schools including Washington Elementary School, Woodrow Wilson School, and Roosevelt High School.
Ownership History
Date
Name
Owned For
Owner Type
Purchase Details
Closed on
Nov 1, 2017
Sold by
Susanka Mary Ann and Susanka Brian
Bought by
Memmon Robert E
Current Estimated Value
Purchase Details
Closed on
Jun 11, 2014
Sold by
Olender Kevin P and Olender Mark E
Bought by
Olender Mary Ann Susanka
Purchase Details
Closed on
Jun 8, 2012
Sold by
Olender Mary Ann Susanka
Bought by
Olender Mary Ann Susanka
Purchase Details
Closed on
Mar 18, 2012
Sold by
Olender Mary Ann Susanka
Bought by
Olender Mary Ann Susanka
Purchase Details
Closed on
Aug 13, 2007
Sold by
Susanka Edward and Susanka Veronica
Bought by
Olender Mary Ann Susanka
Create a Home Valuation Report for This Property
The Home Valuation Report is an in-depth analysis detailing your home's value as well as a comparison with similar homes in the area
Home Values in the Area
Average Home Value in this Area
Purchase History
| Date | Buyer | Sale Price | Title Company |
|---|---|---|---|
| Memmon Robert E | $120,000 | None Available | |
| Olender Mary Ann Susanka | -- | None Available | |
| Olender Mary Ann Susanka | -- | None Available | |
| Olender Mary Ann Susanka | -- | None Available | |
| Olender Mary Ann Susanka | -- | None Available |
Source: Public Records
Tax History Compared to Growth
Tax History
| Year | Tax Paid | Tax Assessment Tax Assessment Total Assessment is a certain percentage of the fair market value that is determined by local assessors to be the total taxable value of land and additions on the property. | Land | Improvement |
|---|---|---|---|---|
| 2025 | $3,201 | $111,600 | $0 | $0 |
| 2024 | $3,201 | $105,800 | $0 | $0 |
| 2023 | $3,053 | $98,000 | $0 | $0 |
| 2022 | $3,537 | $82,200 | $0 | $0 |
| 2021 | $3,466 | $79,700 | $0 | $0 |
| 2020 | $3,418 | $71,000 | $0 | $0 |
| 2019 | $3,371 | $63,800 | $0 | $0 |
| 2018 | $2,691 | $76,400 | $0 | $0 |
| 2017 | $1,257 | $76,400 | $0 | $0 |
| 2016 | $3,471 | $70,700 | $0 | $0 |
| 2015 | $6,194 | $65,600 | $0 | $0 |
| 2013 | $6,000 | $60,000 | $0 | $0 |
| 2012 | $2,915 | $62,800 | $10,800 | $52,000 |
Source: Public Records
Map
Nearby Homes