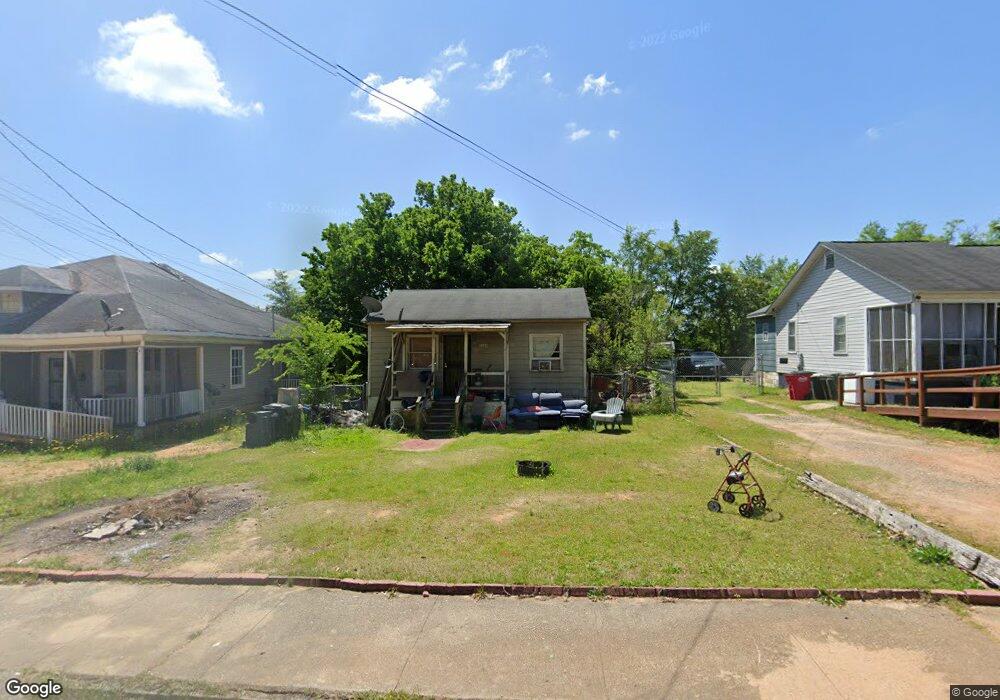
2664 Cherry Ave Macon, GA 31204
Napier Heights Historic District NeighborhoodEstimated Value: $41,000 - $82,000
2
Beds
1
Bath
800
Sq Ft
$82/Sq Ft
Est. Value
About This Home
This home is located at 2664 Cherry Ave, Macon, GA 31204 and is currently estimated at $65,760, approximately $82 per square foot. 2664 Cherry Ave is a home located in Bibb County with nearby schools including Brookdale Elementary School, Miller Fine Arts Magnet Middle School, and Central High School.
Ownership History
Date
Name
Owned For
Owner Type
Purchase Details
Closed on
Mar 7, 2019
Sold by
Fletcher Zachary
Bought by
Firebaugh Paul Daniel
Current Estimated Value
Home Financials for this Owner
Home Financials are based on the most recent Mortgage that was taken out on this home.
Original Mortgage
$55,000
Outstanding Balance
$34,742
Interest Rate
4.5%
Mortgage Type
Commercial
Estimated Equity
$31,018
Purchase Details
Closed on
Feb 8, 2019
Sold by
Dina Properties Llc
Bought by
Fletcher Zachary
Home Financials for this Owner
Home Financials are based on the most recent Mortgage that was taken out on this home.
Original Mortgage
$55,000
Outstanding Balance
$34,742
Interest Rate
4.5%
Mortgage Type
Commercial
Estimated Equity
$31,018
Purchase Details
Closed on
Aug 27, 2013
Sold by
Dsjl Holdings Inc
Bought by
Dina Properties Llc
Purchase Details
Closed on
Aug 14, 2012
Sold by
Mcmichael Thomas J and Mcmichael Laverne G
Bought by
Dsil Holdings Inc
Purchase Details
Closed on
Dec 1, 1995
Sold by
Mcmichael Thomas J and Mcmichael Laverne G
Bought by
Dsjl Holdings Inc
Create a Home Valuation Report for This Property
The Home Valuation Report is an in-depth analysis detailing your home's value as well as a comparison with similar homes in the area
Home Values in the Area
Average Home Value in this Area
Purchase History
| Date | Buyer | Sale Price | Title Company |
|---|---|---|---|
| Firebaugh Paul Daniel | $4,000 | None Available | |
| Fletcher Zachary | $35,000 | None Available | |
| Dina Properties Llc | $15,000 | -- | |
| Dsil Holdings Inc | $10,000 | None Available | |
| Dsjl Holdings Inc | $556,800 | -- |
Source: Public Records
Mortgage History
| Date | Status | Borrower | Loan Amount |
|---|---|---|---|
| Open | Fletcher Zachary | $55,000 |
Source: Public Records
Tax History Compared to Growth
Tax History
| Year | Tax Paid | Tax Assessment Tax Assessment Total Assessment is a certain percentage of the fair market value that is determined by local assessors to be the total taxable value of land and additions on the property. | Land | Improvement |
|---|---|---|---|---|
| 2025 | $221 | $9,008 | $1,920 | $7,088 |
| 2024 | $229 | $9,008 | $1,920 | $7,088 |
| 2023 | $203 | $7,975 | $1,280 | $6,695 |
| 2022 | $182 | $5,271 | $2,154 | $3,117 |
| 2021 | $192 | $5,056 | $2,154 | $2,902 |
| 2020 | $62 | $4,841 | $2,154 | $2,687 |
| 2019 | $195 | $4,993 | $2,202 | $2,791 |
| 2018 | $490 | $5,179 | $2,202 | $2,977 |
| 2017 | $194 | $5,179 | $2,202 | $2,977 |
| 2016 | $179 | $5,179 | $2,202 | $2,977 |
| 2015 | $254 | $5,179 | $2,202 | $2,977 |
| 2014 | $292 | $5,179 | $2,202 | $2,977 |
Source: Public Records
Map
Nearby Homes
- 1340 Courtland Ave
- 1518 Marigold Ave
- 1285 Pio Nono Ave
- 1568 Marigold Ave
- 1580 Marigold Ave
- 1198 Winton Ave
- 2686 Napier Ave
- 1485 Brentwood Ave
- 2773 Beech Ave
- 1198 Brentwood Ave
- 1495 Ninadel Dr
- 297 Pansy Ave
- 2534 Napier Ave
- 254 Lilly Ave
- 2485 Beech Ave
- 1195 Brentwood Ave
- 1171 Brentwood Ave
- 2497 Napier Ave
- 466 Petunia Ave
- 2435 Napier Ave
- 2670 Cherry Ave
- 2652 Cherry Ave
- 2679 Montpelier Ave
- 2663 Cherry Ave
- 1381 Courtland Ave
- 2680/82 Cherry Ave
- 2680 Cherry Ave
- 0 Cherry Ave Unit 8510913
- 2661 Montpelier Ave
- 1396 Courtland Ave
- 1355 Courtland Ave
- 1384 Courtland Ave
- 1384 Hillyer Ave
- 2690 Montpelier Ave
- 1370 Courtland Ave
- 1372 Hillyer Ave
- 1396 Hillyer Ave
- 2694 Montpelier Ave
- 2644 Montpelier Ave
- 1343 Courtland Ave