Estimated Value: $488,446 - $572,000
5
Beds
3
Baths
2,400
Sq Ft
$226/Sq Ft
Est. Value
About This Home
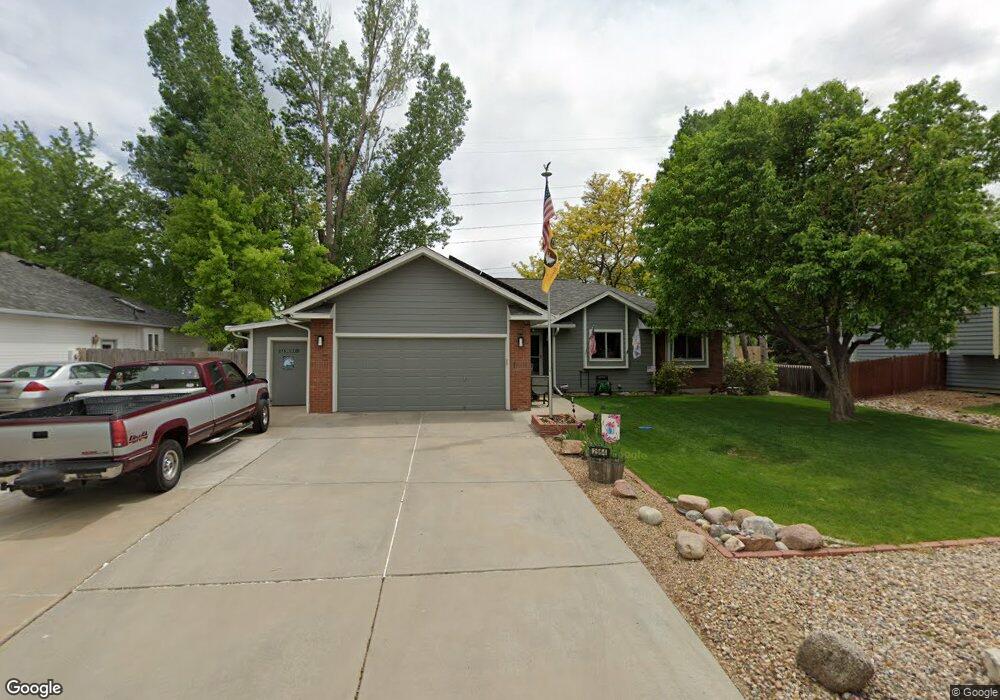
This home is located at 2664 Jarett Dr, Mead, CO 80542 and is currently estimated at $543,362, approximately $226 per square foot. 2664 Jarett Dr is a home located in Weld County with nearby schools including Mead Elementary School, Mead Middle School, and Mead High School.
Ownership History
Date
Name
Owned For
Owner Type
Purchase Details
Closed on
Jun 30, 2000
Sold by
Lamirand Connie M and Lamirand James S
Bought by
Schuler Gary L and Schuler Joann R
Current Estimated Value
Home Financials for this Owner
Home Financials are based on the most recent Mortgage that was taken out on this home.
Original Mortgage
$165,000
Outstanding Balance
$60,839
Interest Rate
8.66%
Estimated Equity
$482,523
Purchase Details
Closed on
Jul 11, 1997
Sold by
Folden Charles W
Bought by
Lamirand Connie M and Lamirand James S
Home Financials for this Owner
Home Financials are based on the most recent Mortgage that was taken out on this home.
Original Mortgage
$136,200
Interest Rate
7.85%
Purchase Details
Closed on
Apr 25, 1995
Sold by
Mc Hugh Homes Inc
Bought by
Folden Charles W
Purchase Details
Closed on
Sep 1, 1994
Sold by
Howland Anthony M
Bought by
Mchugh Homes Inc
Create a Home Valuation Report for This Property
The Home Valuation Report is an in-depth analysis detailing your home's value as well as a comparison with similar homes in the area
Home Values in the Area
Average Home Value in this Area
Purchase History
| Date | Buyer | Sale Price | Title Company |
|---|---|---|---|
| Schuler Gary L | $213,000 | First American Heritage Titl | |
| Lamirand Connie M | $144,900 | -- | |
| Folden Charles W | $132,000 | -- | |
| Mchugh Homes Inc | $25,500 | -- |
Source: Public Records
Mortgage History
| Date | Status | Borrower | Loan Amount |
|---|---|---|---|
| Open | Schuler Gary L | $165,000 | |
| Previous Owner | Lamirand Connie M | $136,200 |
Source: Public Records
Tax History Compared to Growth
Tax History
| Year | Tax Paid | Tax Assessment Tax Assessment Total Assessment is a certain percentage of the fair market value that is determined by local assessors to be the total taxable value of land and additions on the property. | Land | Improvement |
|---|---|---|---|---|
| 2025 | $2,426 | $31,720 | $7,880 | $23,840 |
| 2024 | $2,426 | $31,720 | $7,880 | $23,840 |
| 2023 | $2,338 | $33,490 | $5,750 | $27,740 |
| 2022 | $1,974 | $25,440 | $5,560 | $19,880 |
| 2021 | $2,012 | $26,170 | $5,720 | $20,450 |
| 2020 | $1,880 | $25,080 | $5,010 | $20,070 |
| 2019 | $1,877 | $25,080 | $5,010 | $20,070 |
| 2018 | $1,488 | $21,550 | $4,030 | $17,520 |
| 2017 | $1,434 | $21,550 | $4,030 | $17,520 |
| 2016 | $1,241 | $20,320 | $3,580 | $16,740 |
| 2015 | $1,981 | $20,330 | $3,580 | $16,750 |
| 2014 | $1,750 | $18,010 | $3,580 | $14,430 |
Source: Public Records
Map
Nearby Homes
- 425 6th St
- 0 County Road 34 5 Unit 1018123
- 16071 Ginger Ave
- 241 Main St
- 16084 Cinnamon Cir
- 16737 Lake Helen Blvd
- 126 2nd St
- 16873 Ballinger Cir
- 16923 Ballinger Cir
- 16815 Mckay Dr
- 3425 Ballinger Cir
- 15283 Ypsilon Cir
- 16860 Mckay Dr
- Silverton Plan at Highlands Preserve
- Jefferson Plan at Highlands Preserve
- Keystone II Plan at Highlands Preserve
- Minturn Plan at Highlands Preserve
- Lakewood II Plan at Highlands Preserve
- Jansen Plan at Highlands Preserve
- Gunnison Plan at Highlands Preserve