Estimated Value: $1,298,000
5
Beds
5
Baths
2,760
Sq Ft
$470/Sq Ft
Est. Value
About This Home
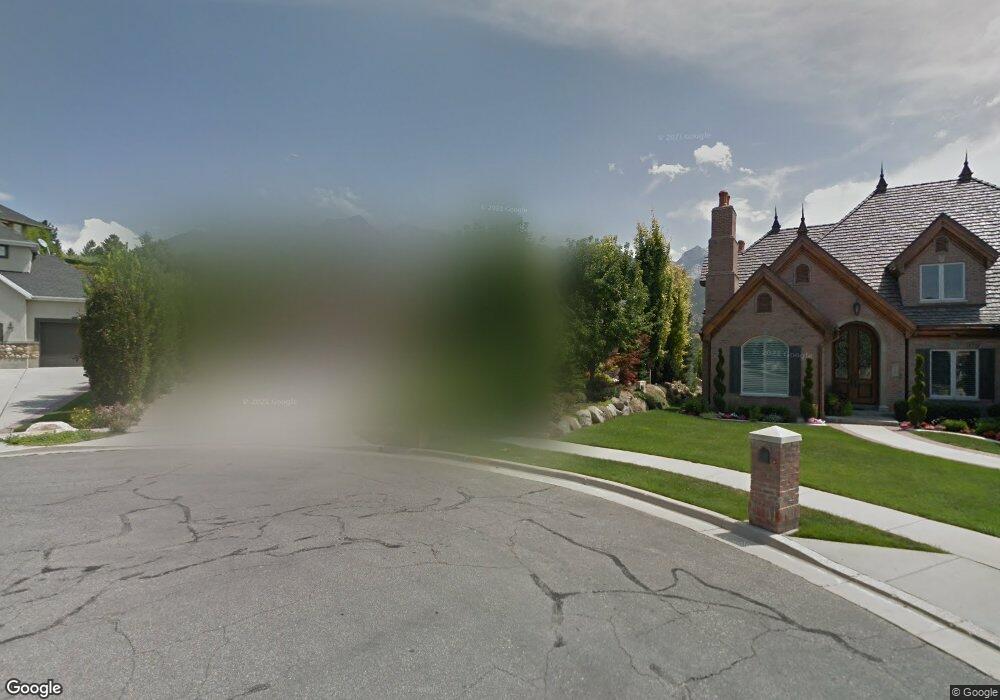
This home is located at 2665 Chalet Cir, Sandy, UT 84093 and is currently priced at $1,298,000, approximately $470 per square foot. 2665 Chalet Cir is a home located in Salt Lake County with nearby schools including Brookwood Elementary School, Butler Middle School, and Brighton High School.
Ownership History
Date
Name
Owned For
Owner Type
Purchase Details
Closed on
Apr 22, 2020
Sold by
Vargo William C and Vargo Kathleen K
Bought by
Vargo William C and Vargo Kathleen K
Current Estimated Value
Purchase Details
Closed on
Jun 25, 2003
Sold by
Vargo Kathleen K
Bought by
Vargo William C and Vargo Kathleen K
Purchase Details
Closed on
Jan 29, 2003
Sold by
Vargo William C and Vargo Kathleen K
Bought by
Vargo Kathleen K
Home Financials for this Owner
Home Financials are based on the most recent Mortgage that was taken out on this home.
Original Mortgage
$262,000
Interest Rate
5.97%
Purchase Details
Closed on
Nov 25, 1997
Sold by
K B Builders Inc
Bought by
Vargo William C and Vargo Kathleen K
Home Financials for this Owner
Home Financials are based on the most recent Mortgage that was taken out on this home.
Original Mortgage
$315,000
Interest Rate
7.33%
Purchase Details
Closed on
Dec 17, 1996
Sold by
Millers Willow Creek Development Lc
Bought by
K B Builders Inc
Create a Home Valuation Report for This Property
The Home Valuation Report is an in-depth analysis detailing your home's value as well as a comparison with similar homes in the area
Home Values in the Area
Average Home Value in this Area
Purchase History
| Date | Buyer | Sale Price | Title Company |
|---|---|---|---|
| Vargo William C | -- | Cottonwood Title | |
| Vargo William C | -- | -- | |
| Vargo Kathleen K | -- | Metro National Title | |
| Vargo William C | -- | Metro National Title | |
| Vargo William C | -- | -- | |
| K B Builders Inc | -- | -- |
Source: Public Records
Mortgage History
| Date | Status | Borrower | Loan Amount |
|---|---|---|---|
| Previous Owner | Vargo William C | $262,000 | |
| Previous Owner | Vargo William C | $315,000 |
Source: Public Records
Tax History
| Year | Tax Paid | Tax Assessment Tax Assessment Total Assessment is a certain percentage of the fair market value that is determined by local assessors to be the total taxable value of land and additions on the property. | Land | Improvement |
|---|---|---|---|---|
| 2020 | $6,312 | $844,700 | $333,100 | $511,600 |
| 2019 | $5,883 | $764,500 | $333,100 | $431,400 |
| 2018 | $5,572 | $752,900 | $329,200 | $423,700 |
| 2017 | $5,563 | $729,100 | $329,200 | $399,900 |
| 2016 | $5,606 | $712,600 | $329,200 | $383,400 |
| 2015 | $5,562 | $655,100 | $290,000 | $365,100 |
| 2014 | $5,369 | $614,700 | $273,700 | $341,000 |
Source: Public Records
Map
Nearby Homes
- 2614 E Tuxedo Cir
- 2591 E Creek Rd
- 7970 S Grand Vista Way
- 2600 E Oak Creek Dr
- 8122 S Willow Creek Cove
- 3075 E Creek Rd
- 8179 Nordic Cir
- 2670 Bridger Blvd Unit 8
- 2615 E Canterbury Ln
- 7609 S 2700 E
- 8585 Mount Majestic Rd
- 2569 E Canterbury Ln
- 3181 E Deer Cir
- 2673 Toni Cir
- 2238 Cottonwood Cove Ln
- 8597 Mount Majestic Rd
- 8266 S Creek Hollow Cove
- 2161 E Lorita Way
- 2152 E Creek Rd
- 3261 E Lantern Hill Ct
- 2663 Chalet Cir
- 2725 E Creek Rd
- 2663 E Chalet Cir
- 2660 E Chalet Cir
- 8060 S Torring Ct
- 2655 Chalet Cir
- 2650 Chalet Cir
- 2704 Grand Vista Way
- 2703 Water Vista Way
- 2698 Grand Vista Way
- 8062 S Torring Ct
- 2644 Chalet Cir
- 2688 Grand Vista Way
- 8064 S Torring Ct
- 2723 Water Vista Way
- 2649 Chalet Cir
- 2624 E Tuxedo Cir
- 2624 E Tuxedo Cir Unit 330
- 2688 E Grand Vista Way
- 2597 Chalet Cir Unit 315B