Estimated Value: $294,000 - $331,000
2
Beds
1
Bath
895
Sq Ft
$350/Sq Ft
Est. Value
About This Home
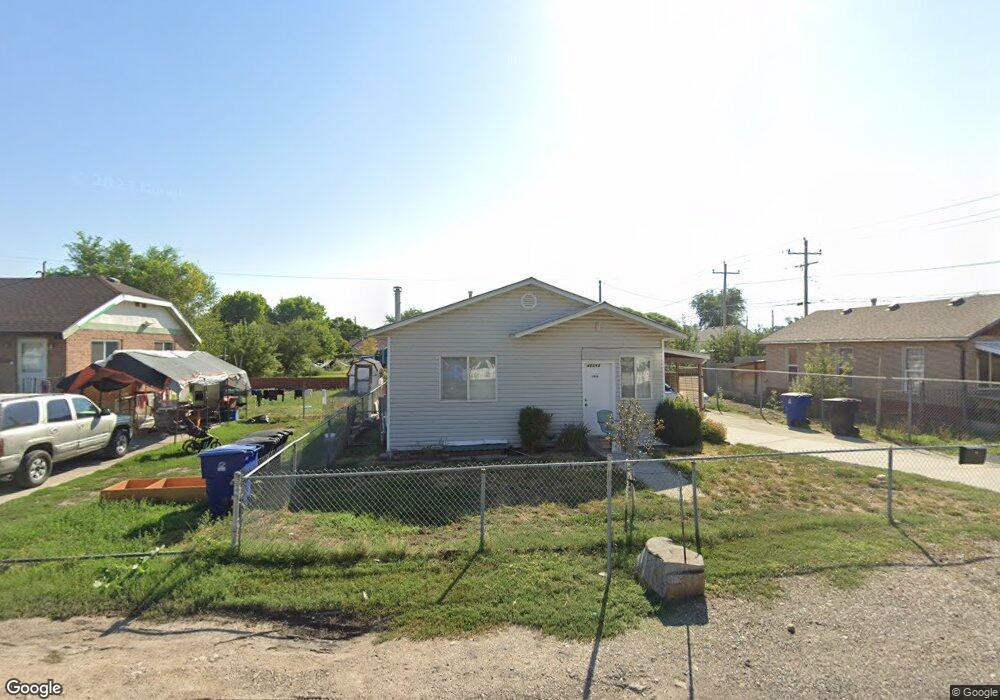
This home is located at 2665 S 8550 W, Magna, UT 84044 and is currently estimated at $313,227, approximately $349 per square foot. 2665 S 8550 W is a home located in Salt Lake County with nearby schools including Magna Elementary School, Cyprus High School, and Entheos Academy - Magna Campus.
Ownership History
Date
Name
Owned For
Owner Type
Purchase Details
Closed on
Jun 10, 2003
Sold by
Weeks Seth V and Weeks Lacinda A
Bought by
Weeks Seth
Current Estimated Value
Home Financials for this Owner
Home Financials are based on the most recent Mortgage that was taken out on this home.
Original Mortgage
$56,000
Interest Rate
5.61%
Mortgage Type
Purchase Money Mortgage
Purchase Details
Closed on
Sep 23, 1998
Sold by
Weeks Seth V
Bought by
Weeks Seth and Weeks Lacinda A
Purchase Details
Closed on
Feb 15, 1996
Sold by
Bates Richard C and Bates Angelina I
Bought by
Weeks Seth
Home Financials for this Owner
Home Financials are based on the most recent Mortgage that was taken out on this home.
Original Mortgage
$61,200
Interest Rate
6.99%
Purchase Details
Closed on
Apr 14, 1994
Sold by
Andersen Tamralee
Bought by
Bates Richard C and Bates Angelina I
Home Financials for this Owner
Home Financials are based on the most recent Mortgage that was taken out on this home.
Original Mortgage
$39,667
Interest Rate
7.59%
Mortgage Type
FHA
Create a Home Valuation Report for This Property
The Home Valuation Report is an in-depth analysis detailing your home's value as well as a comparison with similar homes in the area
Home Values in the Area
Average Home Value in this Area
Purchase History
| Date | Buyer | Sale Price | Title Company |
|---|---|---|---|
| Weeks Seth | -- | Brighton Title | |
| Weeks Seth | -- | -- | |
| Weeks Seth | -- | -- | |
| Bates Richard C | -- | -- |
Source: Public Records
Mortgage History
| Date | Status | Borrower | Loan Amount |
|---|---|---|---|
| Closed | Weeks Seth | $56,000 | |
| Previous Owner | Weeks Seth | $61,200 | |
| Previous Owner | Bates Richard C | $39,667 |
Source: Public Records
Tax History Compared to Growth
Tax History
| Year | Tax Paid | Tax Assessment Tax Assessment Total Assessment is a certain percentage of the fair market value that is determined by local assessors to be the total taxable value of land and additions on the property. | Land | Improvement |
|---|---|---|---|---|
| 2025 | $1,578 | $229,500 | $103,800 | $125,700 |
| 2024 | $1,578 | $210,000 | $96,100 | $113,900 |
| 2023 | $1,614 | $206,000 | $92,400 | $113,600 |
| 2022 | $1,476 | $191,000 | $90,600 | $100,400 |
| 2021 | $1,342 | $151,800 | $69,700 | $82,100 |
| 2020 | $1,275 | $133,900 | $63,400 | $70,500 |
| 2019 | $1,203 | $128,200 | $45,100 | $83,100 |
| 2018 | $1,256 | $130,000 | $45,100 | $84,900 |
| 2017 | $1,059 | $114,200 | $45,100 | $69,100 |
| 2016 | $934 | $102,800 | $40,300 | $62,500 |
| 2015 | $1,095 | $103,800 | $45,900 | $57,900 |
| 2014 | $979 | $96,000 | $42,900 | $53,100 |
Source: Public Records
Map
Nearby Homes
- 2637 S 8590 W
- 2624 S 8550 W
- 2632 S 8550 W
- 2620 S 8590 W
- 2739 S Buccaneer Dr
- 2623 S 8800 W
- 2859 S 8500 W
- 8740 W Magna Main St
- 2831 S Merton Way
- 2758 S 8800 W
- 2775 S Patricia Cir
- 2748 S Saysay Way Unit 11
- 8885 W Magna Main St
- 2767 S Saysay Way Unit 21
- 2938 S Cyprus Ln
- 2748 S 8950 W
- 2849 S 8950 W
- 2992 S 8850 W
- 3031 S 8400 W
- 2659 S 9080 W
- 2667 S 8550 W
- 2659 S 8550 W
- 2666 S 8550 W
- 2671 S 8550 W
- 8538 W 2700 S
- 8546 W 2700 S
- 8544 W 2700 S
- 2655 S 8550 W
- 8544 W Magna Main St
- 8540 W 2700 S
- 8562 W Magna Main St
- 8540 W Magna Main St
- 8562 W 2700 S
- 2654 S 8550 W
- 8534 W Magna Main St
- 2650 S 8550 W
- 2650 S 8550 W Unit 2-9
- 8528 W 2700 S Unit 8530
- 2651 S 8550 W
- 8528 W Magna Main St