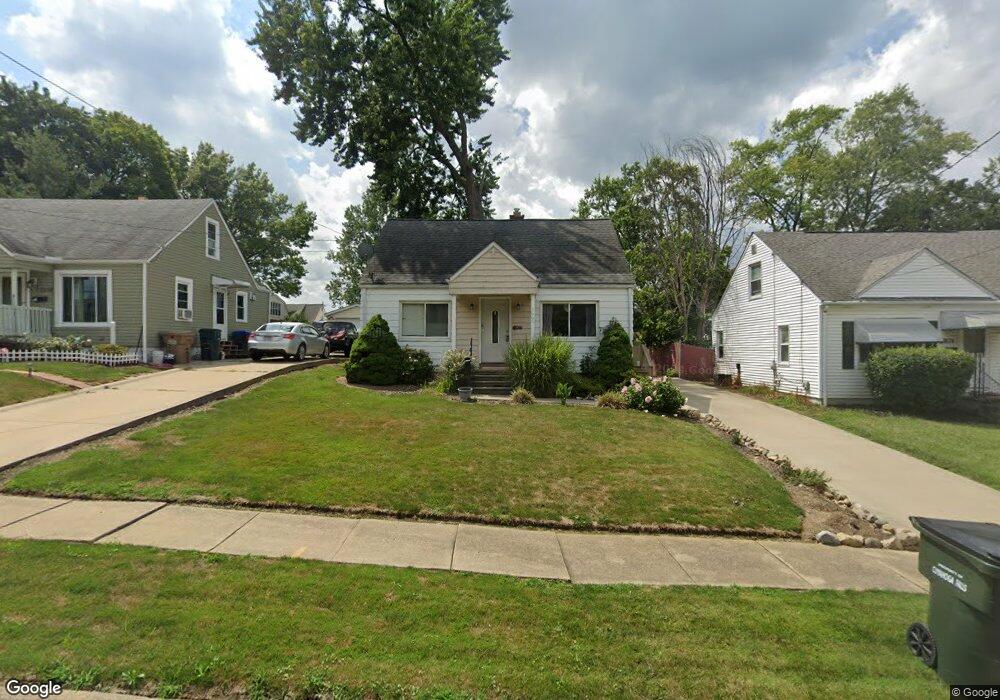
2666 12th St Cuyahoga Falls, OH 44223
Mud Brook NeighborhoodEstimated Value: $163,000 - $187,000
3
Beds
1
Bath
985
Sq Ft
$177/Sq Ft
Est. Value
About This Home
This home is located at 2666 12th St, Cuyahoga Falls, OH 44223 and is currently estimated at $174,044, approximately $176 per square foot. 2666 12th St is a home located in Summit County with nearby schools including Richardson Elementary School, Bolich Middle School, and Cuyahoga Falls High School.
Ownership History
Date
Name
Owned For
Owner Type
Purchase Details
Closed on
Jul 28, 2011
Sold by
Sear Mike and Lavoie Lee
Bought by
Cuningham David W and Deluca Jane
Current Estimated Value
Home Financials for this Owner
Home Financials are based on the most recent Mortgage that was taken out on this home.
Original Mortgage
$46,000
Interest Rate
4.64%
Mortgage Type
Purchase Money Mortgage
Purchase Details
Closed on
Dec 9, 2010
Sold by
Stewardship Fund #2 Lp
Bought by
Sear Mike and Lovoie Lee
Purchase Details
Closed on
Aug 23, 2010
Sold by
Romanski Kimberly A
Bought by
Stewardship Fund #2 Lp
Purchase Details
Closed on
Mar 31, 1998
Sold by
Romanski Cynthia A
Bought by
Romanski Kimberly A
Home Financials for this Owner
Home Financials are based on the most recent Mortgage that was taken out on this home.
Original Mortgage
$70,148
Interest Rate
7.15%
Mortgage Type
New Conventional
Create a Home Valuation Report for This Property
The Home Valuation Report is an in-depth analysis detailing your home's value as well as a comparison with similar homes in the area
Home Values in the Area
Average Home Value in this Area
Purchase History
| Date | Buyer | Sale Price | Title Company |
|---|---|---|---|
| Cuningham David W | $94,000 | Wigley Title Agency Inc | |
| Sear Mike | $42,000 | Quality Title | |
| Stewardship Fund #2 Lp | -- | None Available | |
| Romanski Kimberly A | $66,000 | -- |
Source: Public Records
Mortgage History
| Date | Status | Borrower | Loan Amount |
|---|---|---|---|
| Previous Owner | Cuningham David W | $46,000 | |
| Previous Owner | Romanski Kimberly A | $70,148 |
Source: Public Records
Tax History Compared to Growth
Tax History
| Year | Tax Paid | Tax Assessment Tax Assessment Total Assessment is a certain percentage of the fair market value that is determined by local assessors to be the total taxable value of land and additions on the property. | Land | Improvement |
|---|---|---|---|---|
| 2025 | $3,863 | $46,771 | $10,703 | $36,068 |
| 2024 | $2,525 | $46,771 | $10,703 | $36,068 |
| 2023 | $3,863 | $46,771 | $10,703 | $36,068 |
| 2022 | $2,428 | $36,541 | $8,362 | $28,179 |
| 2021 | $2,428 | $36,541 | $8,362 | $28,179 |
| 2020 | $2,389 | $36,540 | $8,360 | $28,180 |
| 2019 | $2,419 | $33,700 | $8,110 | $25,590 |
| 2018 | $2,054 | $33,700 | $8,110 | $25,590 |
| 2017 | $1,867 | $33,700 | $8,110 | $25,590 |
| 2016 | $1,869 | $31,050 | $8,110 | $22,940 |
| 2015 | $1,867 | $31,050 | $8,110 | $22,940 |
| 2014 | $1,868 | $31,050 | $8,110 | $22,940 |
| 2013 | $1,775 | $29,750 | $8,110 | $21,640 |
Source: Public Records
Map
Nearby Homes