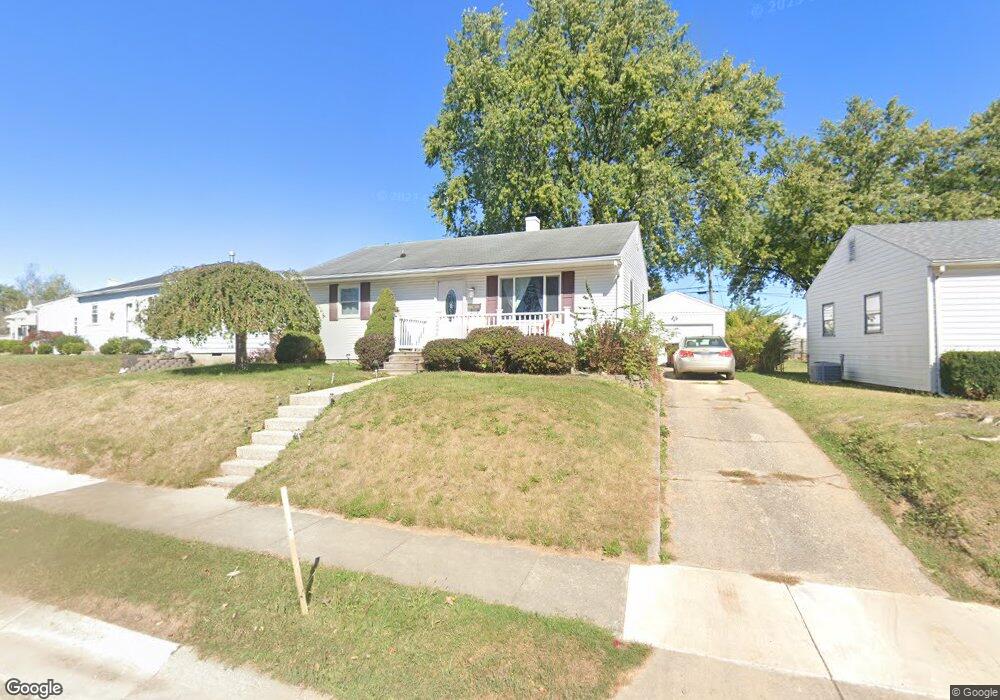
2666 Allen Dr Springfield, OH 45505
Estimated Value: $82,000 - $124,000
3
Beds
1
Bath
816
Sq Ft
$137/Sq Ft
Est. Value
About This Home
This home is located at 2666 Allen Dr, Springfield, OH 45505 and is currently estimated at $112,020, approximately $137 per square foot. 2666 Allen Dr is a home located in Clark County with nearby schools including Mann Elementary School, Schaefer Middle School, and Springfield High School.
Ownership History
Date
Name
Owned For
Owner Type
Purchase Details
Closed on
Jun 19, 2017
Sold by
Lakeview Loan Servicing L Lc
Bought by
Houses Done Right Llc
Current Estimated Value
Home Financials for this Owner
Home Financials are based on the most recent Mortgage that was taken out on this home.
Interest Rate
3.91%
Purchase Details
Closed on
Jun 2, 2017
Sold by
Lakeview Loan Servicing Llc
Bought by
Tinham Rosemary
Home Financials for this Owner
Home Financials are based on the most recent Mortgage that was taken out on this home.
Interest Rate
3.91%
Purchase Details
Closed on
Mar 31, 2017
Sold by
Rinehart Jeremy M and Rinehart Cora R
Bought by
Lakeview Loan Servicing Llc
Purchase Details
Closed on
May 5, 2005
Sold by
Sample Leona M
Bought by
Rinehart Jeremy M and Rinehart Cora R
Home Financials for this Owner
Home Financials are based on the most recent Mortgage that was taken out on this home.
Original Mortgage
$70,572
Interest Rate
6.05%
Mortgage Type
FHA
Purchase Details
Closed on
Jul 15, 1988
Create a Home Valuation Report for This Property
The Home Valuation Report is an in-depth analysis detailing your home's value as well as a comparison with similar homes in the area
Home Values in the Area
Average Home Value in this Area
Purchase History
We collect this data history from publicly available records. To have your information removed, we recommend requesting removal directly through your county’s website.
| Date | Buyer | Sale Price | Title Company |
|---|---|---|---|
| Houses Done Right Llc | $4,000,000 | -- | |
| Tinham Rosemary | $40,000 | None Available | |
| Lakeview Loan Servicing Llc | $38,000 | None Available | |
| Rinehart Jeremy M | $71,500 | -- | |
| -- | $37,500 | -- |
Source: Public Records
Mortgage History
We collect this data history from publicly available records. To have your information removed, we recommend requesting removal directly through your county’s website.
| Date | Status | Borrower | Loan Amount |
|---|---|---|---|
| Closed | Houses Done Right Llc | -- | |
| Previous Owner | Rinehart Jeremy M | $70,572 |
Source: Public Records
Tax History
| Year | Tax Paid | Tax Assessment Tax Assessment Total Assessment is a certain percentage of the fair market value that is determined by local assessors to be the total taxable value of land and additions on the property. | Land | Improvement |
|---|---|---|---|---|
| 2025 | $1,468 | $32,020 | $5,000 | $27,020 |
| 2024 | $1,130 | $22,880 | $4,680 | $18,200 |
| 2023 | $1,130 | $22,880 | $4,680 | $18,200 |
| 2022 | $1,158 | $22,880 | $4,680 | $18,200 |
| 2021 | $840 | $15,280 | $3,210 | $12,070 |
| 2020 | $842 | $15,280 | $3,210 | $12,070 |
| 2019 | $844 | $15,280 | $3,210 | $12,070 |
| 2018 | $926 | $16,100 | $2,680 | $13,420 |
| 2017 | $900 | $16,332 | $2,678 | $13,654 |
| 2016 | $901 | $16,332 | $2,678 | $13,654 |
| 2015 | $1,106 | $15,814 | $2,678 | $13,136 |
| 2014 | $1,102 | $15,814 | $2,678 | $13,136 |
| 2013 | $1,090 | $15,814 | $2,678 | $13,136 |
Source: Public Records
Map
Nearby Homes
- 708 Lawnview Ave
- 2409 Mayfair Dr
- 412 Cape Cod Dr
- 325 Gruen Dr
- 360 Buxton Ave
- 374 Raffensperger Ave
- 631 Kramer Rd
- 314 Raffensperger Ave
- 3012 E High St
- 273 Raffensperger Ave
- 263 Raffensperger Ave
- 283 Raffensperger Ave
- 422 Sherwood Park Dr
- 306 S Clairmont Ave
- 266 S Clairmont Ave
- 270 S Clairmont Ave
- 302 S Clairmont Ave
- 264 S Clairmont Ave
- 1979 Kenton St
- 280 S Clairmont Ave
Your Personal Tour Guide
Ask me questions while you tour the home.