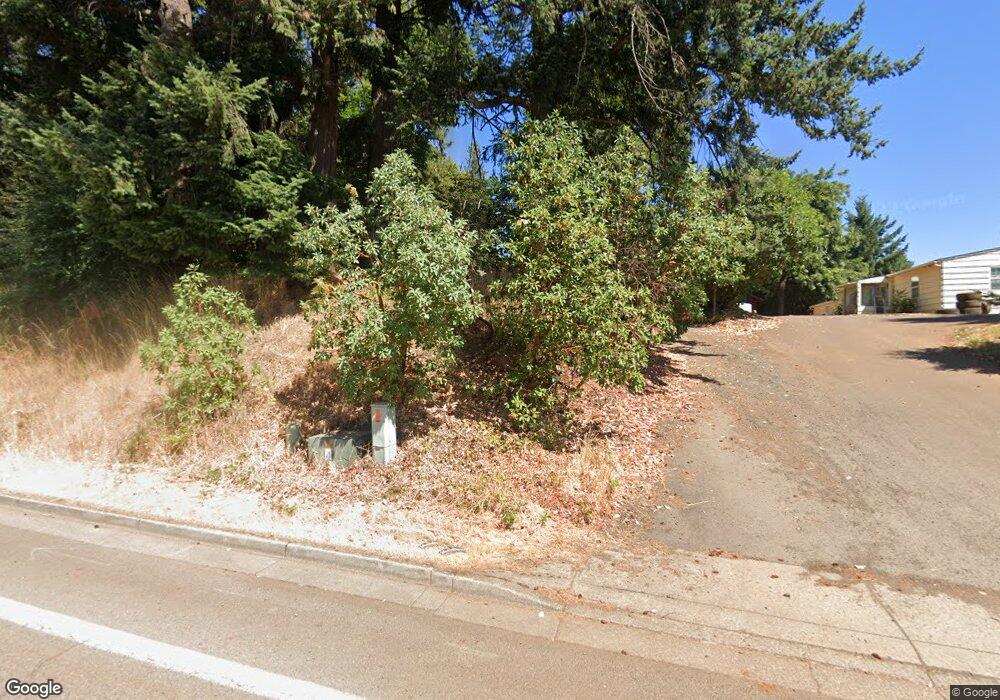
2667 Orchard Heights Rd NW Salem, OR 97304
West Salem NeighborhoodEstimated Value: $394,538 - $580,000
3
Beds
1
Bath
1,450
Sq Ft
$313/Sq Ft
Est. Value
About This Home
This home is located at 2667 Orchard Heights Rd NW, Salem, OR 97304 and is currently estimated at $453,135, approximately $312 per square foot. 2667 Orchard Heights Rd NW is a home located in Polk County with nearby schools including Kalapuya Elementary School, Straub Middle School, and West Salem High School.
Ownership History
Date
Name
Owned For
Owner Type
Purchase Details
Closed on
Feb 7, 2018
Sold by
Deumling Sarah H S
Bought by
Deumling Sarah S and Sarah S Deumling Family Trust
Current Estimated Value
Create a Home Valuation Report for This Property
The Home Valuation Report is an in-depth analysis detailing your home's value as well as a comparison with similar homes in the area
Home Values in the Area
Average Home Value in this Area
Purchase History
| Date | Buyer | Sale Price | Title Company |
|---|---|---|---|
| Deumling Sarah S | -- | None Available |
Source: Public Records
Tax History Compared to Growth
Tax History
| Year | Tax Paid | Tax Assessment Tax Assessment Total Assessment is a certain percentage of the fair market value that is determined by local assessors to be the total taxable value of land and additions on the property. | Land | Improvement |
|---|---|---|---|---|
| 2025 | $3,432 | $187,580 | $101,490 | $86,090 |
| 2024 | $3,432 | $182,120 | $98,530 | $83,590 |
| 2023 | $3,333 | $176,820 | $95,660 | $81,160 |
| 2022 | $3,226 | $171,670 | $92,870 | $78,800 |
| 2021 | $3,134 | $166,670 | $90,170 | $76,500 |
| 2020 | $3,041 | $161,820 | $87,540 | $74,280 |
| 2019 | $2,935 | $157,110 | $84,990 | $72,120 |
| 2018 | $2,886 | $152,540 | $82,510 | $70,030 |
| 2017 | $2,601 | $148,100 | $80,110 | $67,990 |
| 2016 | $2,539 | $143,790 | $77,780 | $66,010 |
| 2015 | $1,747 | $139,610 | $75,510 | $64,100 |
| 2014 | $1,639 | $135,550 | $73,310 | $62,240 |
Source: Public Records
Map
Nearby Homes
- 2869 Mayfly Ave NW
- 1804 Settlers Spring Dr NW
- 1784 Settlers Spring Dr NW
- 0 NW 2nd St
- 2716 Old Farm Ave NW
- Parcel 2 2832 Doaks Ferry Rd NW
- 1598 Bartlett Hill Dr NW
- 2757 Islander Ave NW
- 1559 Bartlett Hill Dr NW
- 1684 Doaks Ferry Rd NW
- 1410 W Meadows Dr NW
- 1739 Gemma St NW
- 2075 Opaque Ave NW
- 1375 Titan Dr NW
- 1610 Gemma St NW
- 2110 Woodhaven Ct NW
- 1630 Onyx St NW
- 2334 Doaks Ferry Rd NW
- 1936 Orchard Heights Rd NW
- 2346 Gibsonwoods Ct NW
- 2647 Orchard Heights Rd NW
- 1900 27th Place NW
- 2821 Butterfly Ave NW
- 2246 27th Place NW
- 2811 Butterfly Ave NW
- 2831 Butterfly Ave NW
- 2841 Butterfly Ave NW
- 2802 Butterfly Ave NW
- 2851 Butterfly Ave NW
- 0 Orchard Heights Rd NW Unit 611101
- Lot 102 Orchard Heights Rd NW
- 0 Orchard Heights Rd NW Unit 680725
- 0 Orchard Heights Rd NW Unit 680079
- Parcel 2 Orchard Heights Rd NW
- 0 Orchard Heights Rd NW Unit 1808
- 0 Titan (Lot #122) Dr NW
- 2587 Orchard Heights Rd NW
- 0 Butterfly Ave NW Unit 255
- 0 Butterfly Ave NW Unit 666372
- 0 Butterfly Ave NW Unit 666427