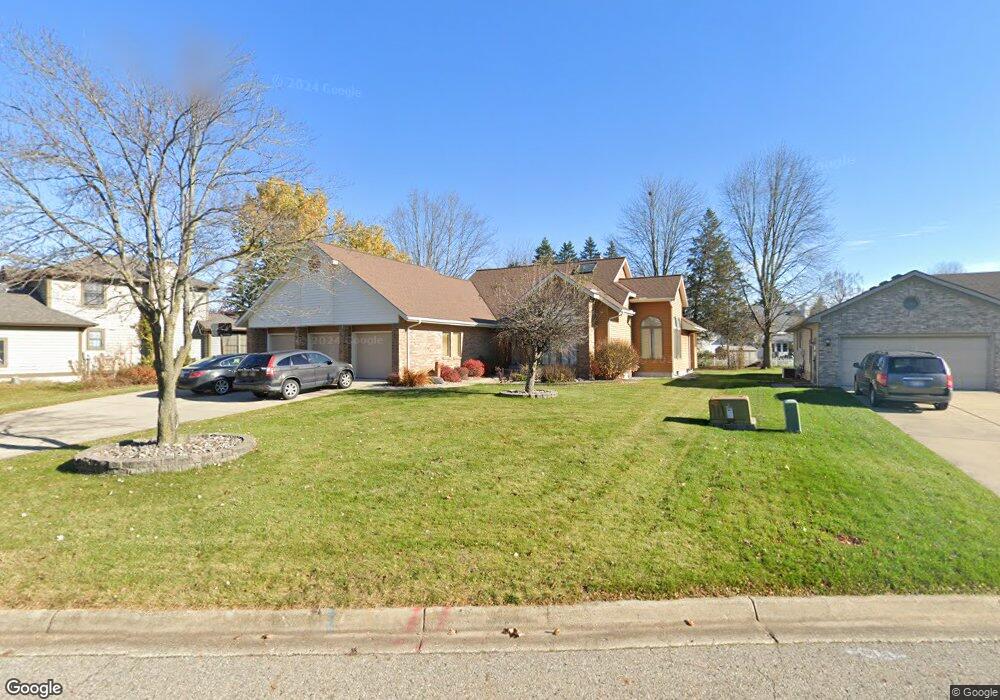
2668 Moreno Dr Lansing, MI 48911
Estimated Value: $378,000 - $389,000
3
Beds
3
Baths
3,807
Sq Ft
$101/Sq Ft
Est. Value
About This Home
This home is located at 2668 Moreno Dr, Lansing, MI 48911 and is currently estimated at $384,089, approximately $100 per square foot. 2668 Moreno Dr is a home located in Ingham County with nearby schools including Horizon Elementary School, Washington Woods Middle School, and Holt Junior High School.
Ownership History
Date
Name
Owned For
Owner Type
Purchase Details
Closed on
Sep 23, 2025
Sold by
Arya Sahar
Bought by
Arya Sana
Current Estimated Value
Purchase Details
Closed on
Aug 26, 2025
Sold by
Kieska Kenneth M and Kieska Tina M
Bought by
Arya Sahar
Purchase Details
Closed on
Jan 26, 2017
Sold by
Kieska Kenneth M
Bought by
Arya Sahar
Purchase Details
Closed on
Mar 13, 2014
Sold by
Kieska Tina M
Bought by
Kieska Kenneth M and Kieska Tina M
Purchase Details
Closed on
Feb 4, 2010
Sold by
Tran Tina M
Bought by
Tran Tina M and Tran Vanessa N T
Purchase Details
Closed on
Aug 10, 2007
Sold by
Tran Van V
Bought by
Tran Tina M
Purchase Details
Closed on
Jun 10, 1996
Purchase Details
Closed on
Jun 1, 1993
Create a Home Valuation Report for This Property
The Home Valuation Report is an in-depth analysis detailing your home's value as well as a comparison with similar homes in the area
Home Values in the Area
Average Home Value in this Area
Purchase History
| Date | Buyer | Sale Price | Title Company |
|---|---|---|---|
| Arya Sana | -- | None Listed On Document | |
| Arya Sahar | $185,000 | None Listed On Document | |
| Arya Sahar | -- | None Available | |
| Kieska Kenneth M | -- | None Available | |
| Kieska Tina M | -- | None Available | |
| Tran Tina M | -- | None Available | |
| Tran Tina M | $40,000 | None Available | |
| -- | $194,000 | -- | |
| -- | $180,000 | -- |
Source: Public Records
Mortgage History
| Date | Status | Borrower | Loan Amount |
|---|---|---|---|
| Closed | Arya Sahar | $0 |
Source: Public Records
Tax History Compared to Growth
Tax History
| Year | Tax Paid | Tax Assessment Tax Assessment Total Assessment is a certain percentage of the fair market value that is determined by local assessors to be the total taxable value of land and additions on the property. | Land | Improvement |
|---|---|---|---|---|
| 2025 | $6,954 | $184,700 | $26,800 | $157,900 |
| 2024 | $6,482 | $176,300 | $24,100 | $152,200 |
| 2023 | $6,482 | $153,700 | $21,800 | $131,900 |
| 2022 | $6,175 | $137,300 | $19,100 | $118,200 |
| 2021 | $6,072 | $129,300 | $14,400 | $114,900 |
| 2020 | $6,246 | $122,500 | $14,400 | $108,100 |
| 2019 | $6,019 | $113,900 | $14,400 | $99,500 |
| 2018 | $6,017 | $111,400 | $14,400 | $97,000 |
| 2017 | $5,081 | $111,400 | $14,400 | $97,000 |
| 2016 | $5,040 | $109,000 | $14,200 | $94,800 |
| 2015 | $5,017 | $105,200 | $27,230 | $77,970 |
| 2014 | $5,017 | $101,400 | $28,847 | $72,553 |
Source: Public Records
Map
Nearby Homes
- 5900 Macmillan Way
- 2656 Gilbert Rd
- 2626 Little Hickory Dr
- 2416 Houghton Hollow Dr
- 2411 Bliesener St
- 2616 Michigan 99
- 6037 Hughes Rd
- 5922 Pheasant Ave
- 2360 Gilbert Rd
- 6810 Meese Dr
- 2340 Washington Rd
- 6263 Marywood Ave
- 6947 Meese Dr
- 6270 S Washington Ave
- 5838 S Martin Luther King Junior Blvd
- 6935 Cooper Rd
- 3425 Independence Ln
- 6301 Cooper Rd
- 1020 R G Curtiss Ave
- 5750 Ashley Dr