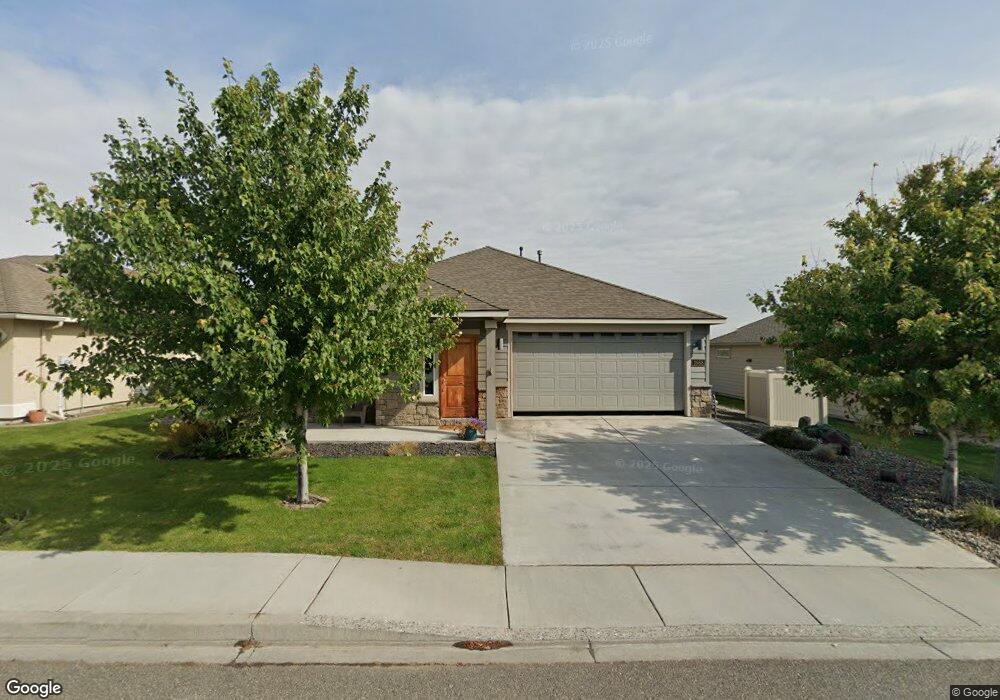
2668 Sandpiper Loop Unit Horn Rapids Area Richland, WA 99354
Estimated Value: $413,375 - $479,000
4
Beds
2
Baths
1,560
Sq Ft
$287/Sq Ft
Est. Value
About This Home
This home is located at 2668 Sandpiper Loop Unit Horn Rapids Area, Richland, WA 99354 and is currently estimated at $447,594, approximately $286 per square foot. 2668 Sandpiper Loop Unit Horn Rapids Area is a home located in Benton County with nearby schools including Sacajawea Elementary School, Chief Joseph Middle School, and Hanford High School.
Ownership History
Date
Name
Owned For
Owner Type
Purchase Details
Closed on
Sep 7, 2016
Sold by
Olsen Deborah L
Bought by
Cornwall Llc
Current Estimated Value
Purchase Details
Closed on
Jul 2, 2012
Sold by
Hayden Homes Llc
Bought by
Olsen Deborah L
Home Financials for this Owner
Home Financials are based on the most recent Mortgage that was taken out on this home.
Original Mortgage
$206,589
Interest Rate
3.63%
Mortgage Type
VA
Purchase Details
Closed on
Sep 12, 2011
Sold by
Sandpiper Richland Llc
Bought by
Hayden Homes Llc
Purchase Details
Closed on
Jun 22, 2011
Sold by
Columbia State Bank
Bought by
Sandpiper Richland Llc
Purchase Details
Closed on
Mar 24, 2011
Sold by
Diamond Built Homes Llc
Bought by
Columbia State Bank
Create a Home Valuation Report for This Property
The Home Valuation Report is an in-depth analysis detailing your home's value as well as a comparison with similar homes in the area
Home Values in the Area
Average Home Value in this Area
Purchase History
| Date | Buyer | Sale Price | Title Company |
|---|---|---|---|
| Cornwall Llc | $228,900 | Stewart Title Company | |
| Olsen Deborah L | $199,990 | Frontier Title & Escrow Co | |
| Hayden Homes Llc | $115,131 | Benton Franklin Title Co | |
| Sandpiper Richland Llc | $650,000 | Benton Franklin Title Co | |
| Columbia State Bank | $644,000 | Frontier Title & Escrow Co |
Source: Public Records
Mortgage History
| Date | Status | Borrower | Loan Amount |
|---|---|---|---|
| Previous Owner | Olsen Deborah L | $206,589 |
Source: Public Records
Tax History Compared to Growth
Tax History
| Year | Tax Paid | Tax Assessment Tax Assessment Total Assessment is a certain percentage of the fair market value that is determined by local assessors to be the total taxable value of land and additions on the property. | Land | Improvement |
|---|---|---|---|---|
| 2024 | $3,103 | $383,260 | $70,000 | $313,260 |
| 2023 | $3,103 | $330,370 | $70,000 | $260,370 |
| 2022 | $2,760 | $273,410 | $70,000 | $203,410 |
| 2021 | $2,684 | $249,000 | $70,000 | $179,000 |
| 2020 | $2,838 | $232,730 | $70,000 | $162,730 |
| 2019 | $2,460 | $232,730 | $70,000 | $162,730 |
| 2018 | $2,587 | $217,250 | $60,900 | $156,350 |
| 2017 | $2,279 | $191,190 | $60,900 | $130,290 |
| 2016 | $2,246 | $191,190 | $60,900 | $130,290 |
| 2015 | $2,289 | $191,190 | $60,900 | $130,290 |
| 2014 | -- | $191,190 | $60,900 | $130,290 |
| 2013 | -- | $191,190 | $60,900 | $130,290 |
Source: Public Records
Map
Nearby Homes
- 2691 Eagle Watch Loop
- 2965 Sonoran Dr
- 3035 Wild Canyon Way
- 2940 Sedona Cir
- 2730 Sawgrass Loop
- 2595 Tilden Ct
- 2539 Prestwick Dr
- 2981 Redrock Ridge Loop
- 3043 Bobwhite Way
- 2895 Sawgrass Loop
- 3216 Wild Canyon Way
- 3020 Redrock Ridge Loop
- 2723 Stonecreek Dr
- 2900 Crosswater Loop
- 2935 Crosswater Loop
- 2818 Tuscanna Dr
- 3263 Emory Ave
- 3262 Emory Ave
- 3256 Emory Ave
- 2834 Centerline Ave
- 2668 Sandpiper Loop
- 2668 Sandpiper Loop Unit Large Patio with a V
- 2672 Sandpiper Loop
- 2664 Sandpiper Loop
- 2664 Sandpiper Loop Unit On the Golf Course
- 2676 Sandpiper Loop
- 2660 Sandpiper Loop
- 2661 Sandpiper Loop
- 2671 Sandpiper Loop
- 2665 Sandpiper Loop
- 2656 Sandpiper Loop
- 2656 Sandpiper Loop Unit Golf Course View
- 2680 Sandpiper Loop
- 2655 Sandpiper Loop
- 2652 Sandpiper Loop
- 2654 Torrey Pines Way Unit Great Community and
- 2654 Torrey Pines Way Unit Peaceful Golf Course
- 2684 Torrey Pines Way
- 2651 Sandpiper Loop
- 2650 Torrey Pines Way Unit Horn Rapids Rambler