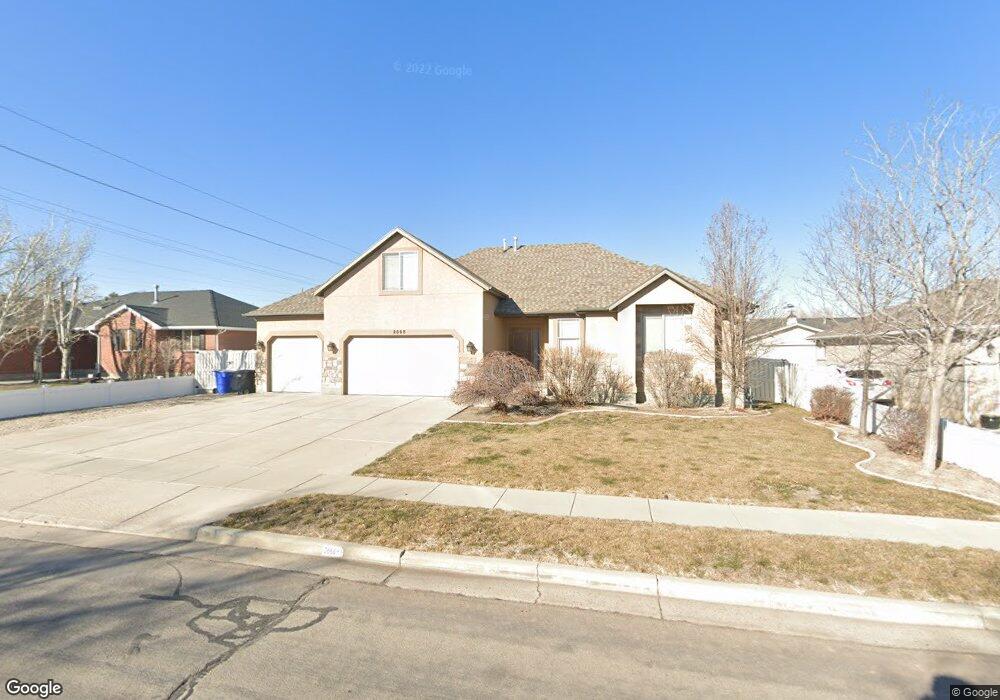
2668 W 7130 S West Jordan, UT 84084
Estimated Value: $641,000 - $798,000
3
Beds
2
Baths
3,841
Sq Ft
$189/Sq Ft
Est. Value
About This Home
This home is located at 2668 W 7130 S, West Jordan, UT 84084 and is currently estimated at $725,807, approximately $188 per square foot. 2668 W 7130 S is a home located in Salt Lake County with nearby schools including Westland Elementary School, West Jordan School, and West Jordan Middle School.
Ownership History
Date
Name
Owned For
Owner Type
Purchase Details
Closed on
Mar 21, 2017
Sold by
Koehler Steven C and Koehler Stacey J
Bought by
Koehler Steven C
Current Estimated Value
Home Financials for this Owner
Home Financials are based on the most recent Mortgage that was taken out on this home.
Original Mortgage
$285,000
Outstanding Balance
$236,337
Interest Rate
4.17%
Mortgage Type
New Conventional
Estimated Equity
$489,470
Purchase Details
Closed on
Sep 1, 2005
Sold by
Perschon Dareth
Bought by
Jordan Cove Construction Inc
Home Financials for this Owner
Home Financials are based on the most recent Mortgage that was taken out on this home.
Original Mortgage
$255,000
Interest Rate
5.64%
Mortgage Type
Purchase Money Mortgage
Purchase Details
Closed on
Jun 9, 2005
Sold by
Loch Lomond Investments Llc
Bought by
Perschon Dareth
Create a Home Valuation Report for This Property
The Home Valuation Report is an in-depth analysis detailing your home's value as well as a comparison with similar homes in the area
Home Values in the Area
Average Home Value in this Area
Purchase History
| Date | Buyer | Sale Price | Title Company |
|---|---|---|---|
| Koehler Steven C | -- | Accommodation | |
| Jordan Cove Construction Inc | -- | Merrill Title | |
| Perschon Dareth | -- | Meridian Title |
Source: Public Records
Mortgage History
| Date | Status | Borrower | Loan Amount |
|---|---|---|---|
| Open | Koehler Steven C | $285,000 | |
| Closed | Jordan Cove Construction Inc | $255,000 |
Source: Public Records
Tax History Compared to Growth
Tax History
| Year | Tax Paid | Tax Assessment Tax Assessment Total Assessment is a certain percentage of the fair market value that is determined by local assessors to be the total taxable value of land and additions on the property. | Land | Improvement |
|---|---|---|---|---|
| 2025 | $3,684 | $731,900 | $141,400 | $590,500 |
| 2024 | $3,684 | $708,800 | $136,400 | $572,400 |
| 2023 | $3,674 | $666,200 | $129,900 | $536,300 |
| 2022 | $3,819 | $681,300 | $127,400 | $553,900 |
| 2021 | $3,236 | $525,500 | $103,900 | $421,600 |
| 2020 | $2,993 | $456,100 | $103,900 | $352,200 |
| 2019 | $3,019 | $451,200 | $103,900 | $347,300 |
| 2018 | $2,788 | $413,300 | $78,500 | $334,800 |
| 2017 | $2,624 | $387,200 | $78,500 | $308,700 |
| 2016 | $2,586 | $358,600 | $78,500 | $280,100 |
| 2015 | $2,489 | $336,500 | $89,700 | $246,800 |
| 2014 | $2,380 | $316,800 | $85,300 | $231,500 |
Source: Public Records
Map
Nearby Homes
- 6918 S Harvest Cir
- 7361 S 2700 W
- 8524 S Michele River Ave W Unit 109
- 2421 W 6900 S
- 2312 W Hidden Bend Cove Unit 107
- 2683 W Carson Ln
- 2510 W Jordan Meadows Ln
- 2573 Jordan Meadows Ln
- 6924 S 2160 W
- 6893 S 3200 W
- 2886 W 7550 S
- 7647 S 2500 W
- 6925 S Lexington Dr
- 1951 W 7125 S
- 7604 S Autumn Dr
- 7150 Camelot Way
- 2386 W 7680 S
- 7149 S Camelot Way
- 2169 W 7600 S
- 7721 Sunset Cir
- 2652 W 7130 S
- 2684 W 7130 S
- 2669 W Beverly Glen Ave
- 7141 S 2700 W Unit 3
- 7095 S 2700 W
- 2685 Beverly Glen Ave
- 2653 Beverly Glen Ave
- 2638 W 7130 S
- 7143 S 2700 W Unit 2
- 7143 S 2700 W Unit 3
- 7143 S 2700 W Unit 9
- 7143 S 2700 W Unit 5
- 7143 S 2700 W Unit 4
- 7143 S 2700 W Unit 6
- 7143 S 2700 W Unit 7
- 7143 S 2700 W Unit 15
- 7143 S 2700 W Unit 8
- 7143 S 2700 W Unit 14
- 7143 S 2700 W Unit 16
- 7143 S 2700 W Unit 11