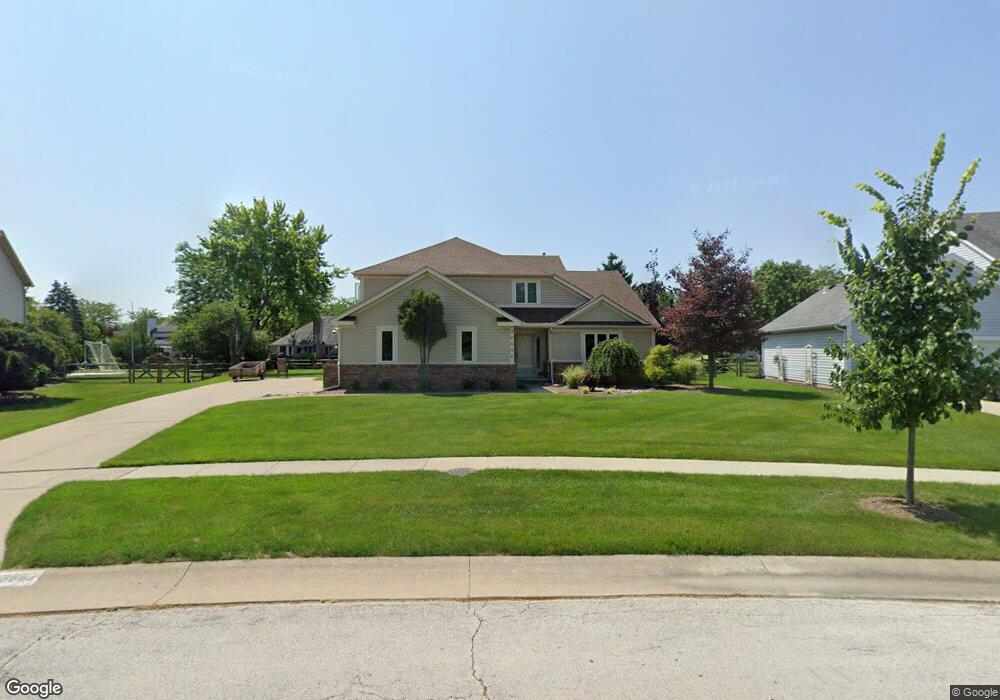
26686 Mohawk Dr Perrysburg, OH 43551
Estimated Value: $443,709 - $467,000
4
Beds
3
Baths
2,900
Sq Ft
$158/Sq Ft
Est. Value
About This Home
This home is located at 26686 Mohawk Dr, Perrysburg, OH 43551 and is currently estimated at $458,677, approximately $158 per square foot. 26686 Mohawk Dr is a home located in Wood County with nearby schools including Fort Meigs Elementary School, Perrysburg Junior High School, and Perrysburg High School.
Ownership History
Date
Name
Owned For
Owner Type
Purchase Details
Closed on
Jan 22, 2016
Sold by
Zetts Michelle M
Bought by
Zetts Steven A
Current Estimated Value
Purchase Details
Closed on
Oct 10, 2014
Sold by
Zetts Michelle M
Bought by
Zetts Steven A
Home Financials for this Owner
Home Financials are based on the most recent Mortgage that was taken out on this home.
Original Mortgage
$200,000
Outstanding Balance
$67,031
Interest Rate
4.08%
Mortgage Type
New Conventional
Estimated Equity
$391,646
Purchase Details
Closed on
Mar 15, 2010
Sold by
Nelson Frederick L and Nelson Mary K
Bought by
Zetts Steven A and Zetts Michelle M
Home Financials for this Owner
Home Financials are based on the most recent Mortgage that was taken out on this home.
Original Mortgage
$200,000
Interest Rate
5.01%
Mortgage Type
New Conventional
Purchase Details
Closed on
Oct 17, 2007
Sold by
Nelson Frederick L and Nelson Mary K
Bought by
Nelson Frederick L and Nelson Mary K
Purchase Details
Closed on
Jun 15, 1990
Bought by
Nelson Frederick L
Create a Home Valuation Report for This Property
The Home Valuation Report is an in-depth analysis detailing your home's value as well as a comparison with similar homes in the area
Home Values in the Area
Average Home Value in this Area
Purchase History
| Date | Buyer | Sale Price | Title Company |
|---|---|---|---|
| Zetts Steven A | -- | None Available | |
| Zetts Steven A | -- | Louisville Title Agency | |
| Zetts Steven A | $250,000 | Attorney | |
| Nelson Frederick L | -- | None Available | |
| Nelson Frederick L | $183,500 | -- |
Source: Public Records
Mortgage History
| Date | Status | Borrower | Loan Amount |
|---|---|---|---|
| Open | Zetts Steven A | $200,000 | |
| Previous Owner | Zetts Steven A | $200,000 |
Source: Public Records
Tax History Compared to Growth
Tax History
| Year | Tax Paid | Tax Assessment Tax Assessment Total Assessment is a certain percentage of the fair market value that is determined by local assessors to be the total taxable value of land and additions on the property. | Land | Improvement |
|---|---|---|---|---|
| 2024 | $7,134 | $123,305 | $19,670 | $103,635 |
| 2023 | $7,134 | $123,310 | $19,670 | $103,640 |
| 2021 | $6,127 | $97,480 | $17,500 | $79,980 |
| 2020 | $6,095 | $97,480 | $17,500 | $79,980 |
| 2019 | $5,647 | $87,640 | $17,500 | $70,140 |
| 2018 | $5,012 | $87,640 | $17,500 | $70,140 |
| 2017 | $4,980 | $87,640 | $17,500 | $70,140 |
| 2016 | $5,088 | $83,440 | $17,500 | $65,940 |
| 2015 | $5,088 | $83,440 | $17,500 | $65,940 |
| 2014 | $5,132 | $83,440 | $17,500 | $65,940 |
| 2013 | $2,626 | $83,440 | $17,500 | $65,940 |
Source: Public Records
Map
Nearby Homes
- 26835 Mohawk Dr
- 2062 Lexington Dr
- 2053 Lexington Dr
- 13975 Eckel Junction Rd
- 26951 Ottekee Dr
- 125 Ottekee Dr
- 700 Delaware Dr
- 26802 Fort Meigs Rd
- 1626 Woodstream Rd
- 670 Ridge Lake Ct
- 0 Brookwoode Rd
- 664 Little Creek Dr
- 471 Rutledge Ct
- 1380 Brookwoode Rd
- 142 Barton Creek Dr
- 144 Barton Creek Dr
- 140 Barton Creek Dr
- 162 Barton Creek Dr
- 158 Barton Creek Dr
- 168 Barton Creek Dr
- 26670 Mohawk Dr
- 26704 Mohawk Dr
- 26579 Mingo Dr
- 26597 Mingo Dr
- 26561 Mingo Dr
- 26652 Mohawk Dr
- 26720 Mohawk Dr
- 26699 Mohawk Dr
- 26615 Mingo Dr
- 26535 Mingo Dr
- 26681 Mohawk Dr
- 26738 Mohawk Dr
- 26669 Mingo Dr
- 26715 Mohawk Dr
- 26689 Mingo Dr
- 26635 Mingo Dr
- 26750 Ottekee Dr
- 26576 Mingo Dr
- 26592 Mingo Dr
- 26754 Mohawk Dr