K
Seller's Agent in 2021
Karen Tadas
DeLex Realty
2 in this area
16 Total Sales

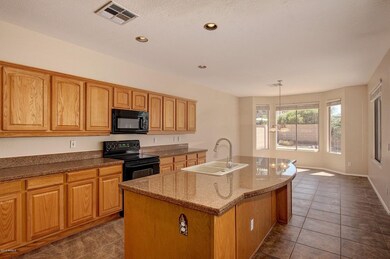
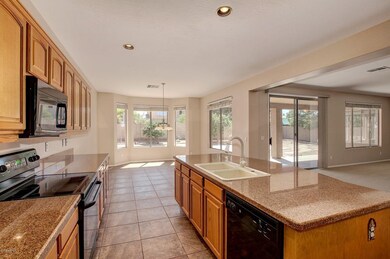
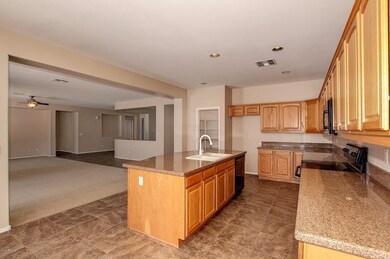
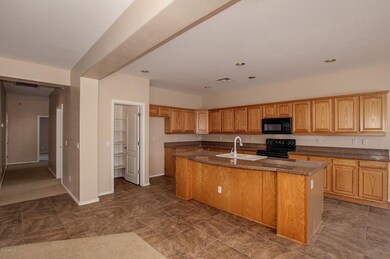
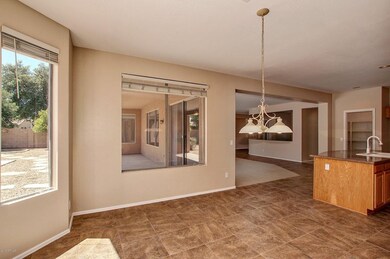
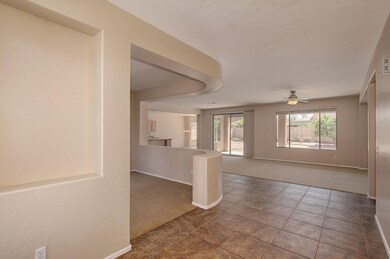
Welcome to Kaibab Place! This beautiful three-bedroom, two-bathroom home with an open layout comes with a covered patio and extended pavers! The spacious Master suite includes a walk-in closet and an ensuite bathroom featuring double sinks, a separate shower and tub, and a private toilet room.
This home comes with a 30-day satisfaction guarantee, 180-point inspection, and one-year premium warranty. Terms and conditions apply.
Last Agent to Sell the Property
Jacqueline Moore
Opendoor Brokerage, LLC License #SA662341000 Listed on: 09/12/2016
| Date | Type | Sale Price | Title Company |
|---|---|---|---|
| Interfamily Deed Transfer | -- | Empire Title Agency | |
| Warranty Deed | $614,250 | Empire Title Agency | |
| Quit Claim Deed | -- | None Available | |
| Warranty Deed | $447,000 | First Arizona Title Agency | |
| Cash Sale Deed | $340,000 | Lawyers Title Of Arizona Inc | |
| Warranty Deed | $369,000 | Fidelity Natl Title Agency I | |
| Cash Sale Deed | $245,760 | Lawyers Title Of Arizona Inc | |
| Special Warranty Deed | -- | Lawyers Title Of Arizona Inc | |
| Cash Sale Deed | $252,815 | Lawyers Title Of Arizona Inc |
| Date | Status | Loan Amount | Loan Type |
|---|---|---|---|
| Open | $460,687 | New Conventional | |
| Closed | $460,687 | No Value Available | |
| Previous Owner | $335,250 | New Conventional | |
| Closed | $0 | Future Advance Clause Open End Mortgage |
| Date | Event | Price | Change | Sq Ft Price |
|---|---|---|---|---|
| 11/19/2021 11/19/21 | Sold | $630,000 | -2.9% | $232 / Sq Ft |
| 11/16/2021 11/16/21 | Price Changed | $649,000 | 0.0% | $239 / Sq Ft |
| 09/28/2021 09/28/21 | Pending | -- | -- | -- |
| 07/28/2021 07/28/21 | For Sale | $649,000 | 0.0% | $239 / Sq Ft |
| 06/10/2021 06/10/21 | Rented | $3,000 | 0.0% | -- |
| 06/02/2021 06/02/21 | For Rent | $3,000 | -9.1% | -- |
| 10/30/2020 10/30/20 | Rented | $3,300 | +22.2% | -- |
| 10/28/2020 10/28/20 | Under Contract | -- | -- | -- |
| 10/22/2020 10/22/20 | For Rent | $2,700 | 0.0% | -- |
| 09/29/2020 09/29/20 | Sold | $447,000 | 0.0% | $165 / Sq Ft |
| 08/22/2020 08/22/20 | Pending | -- | -- | -- |
| 08/21/2020 08/21/20 | For Sale | $447,000 | 0.0% | $165 / Sq Ft |
| 08/14/2020 08/14/20 | Pending | -- | -- | -- |
| 08/13/2020 08/13/20 | For Sale | $447,000 | +31.5% | $165 / Sq Ft |
| 03/03/2017 03/03/17 | Sold | $340,000 | -2.3% | $125 / Sq Ft |
| 02/10/2017 02/10/17 | Pending | -- | -- | -- |
| 02/02/2017 02/02/17 | Price Changed | $348,000 | -0.9% | $128 / Sq Ft |
| 01/26/2017 01/26/17 | Price Changed | $351,000 | -0.3% | $129 / Sq Ft |
| 01/12/2017 01/12/17 | Price Changed | $352,000 | -0.3% | $130 / Sq Ft |
| 01/05/2017 01/05/17 | Price Changed | $353,000 | -0.3% | $130 / Sq Ft |
| 12/29/2016 12/29/16 | Price Changed | $354,000 | -1.1% | $131 / Sq Ft |
| 12/08/2016 12/08/16 | Price Changed | $358,000 | -1.4% | $132 / Sq Ft |
| 11/17/2016 11/17/16 | Price Changed | $363,000 | -1.6% | $134 / Sq Ft |
| 10/27/2016 10/27/16 | Price Changed | $369,000 | -2.1% | $136 / Sq Ft |
| 10/06/2016 10/06/16 | Price Changed | $377,000 | -1.8% | $139 / Sq Ft |
| 10/04/2016 10/04/16 | For Sale | $384,000 | +12.9% | $142 / Sq Ft |
| 09/12/2016 09/12/16 | Off Market | $340,000 | -- | -- |
| 10/01/2014 10/01/14 | Rented | $1,550 | -3.1% | -- |
| 09/29/2014 09/29/14 | Under Contract | -- | -- | -- |
| 08/24/2014 08/24/14 | For Rent | $1,600 | 0.0% | -- |
| 05/01/2012 05/01/12 | Rented | $1,600 | 0.0% | -- |
| 04/09/2012 04/09/12 | Under Contract | -- | -- | -- |
| 04/03/2012 04/03/12 | For Rent | $1,600 | -- | -- |
| Year | Tax Paid | Tax Assessment Tax Assessment Total Assessment is a certain percentage of the fair market value that is determined by local assessors to be the total taxable value of land and additions on the property. | Land | Improvement |
|---|---|---|---|---|
| 2025 | $2,913 | $40,694 | -- | -- |
| 2024 | $3,723 | $38,756 | -- | -- |
| 2023 | $3,723 | $52,420 | $10,480 | $41,940 |
| 2022 | $3,607 | $39,920 | $7,980 | $31,940 |
| 2021 | $3,697 | $37,650 | $7,530 | $30,120 |
| 2020 | $3,123 | $35,860 | $7,170 | $28,690 |
| 2019 | $3,005 | $33,420 | $6,680 | $26,740 |
| 2018 | $2,907 | $31,430 | $6,280 | $25,150 |
| 2017 | $2,712 | $31,260 | $6,250 | $25,010 |
| 2016 | $3,128 | $29,960 | $5,990 | $23,970 |
| 2015 | $2,996 | $29,400 | $5,880 | $23,520 |
K
Seller's Agent in 2021
Karen Tadas
DeLex Realty
2 in this area
16 Total Sales

Seller's Agent in 2021
Shanna Grossman
Tinzie Realty
(602) 882-2831
273 Total Sales
B
Buyer's Agent in 2021
Bhagyashree Gundappa
HomeSmart
(480) 398-6016
2 in this area
28 Total Sales
K
Buyer's Agent in 2021
Kim Toro
Unique Legacy Realty
Seller's Agent in 2020
Ryan Forger
Keller Williams Northeast Realty
(480) 206-1174
2 in this area
19 Total Sales
N
Buyer's Agent in 2020
Non-MLS Agent
Non-MLS Office
Source: Arizona Regional Multiple Listing Service (ARMLS)
MLS Number: 5496401
APN: 303-44-363
Disclaimer: Certain information contained herein is derived from information provided by parties other than Homes.com. All information provided is deemed reliable, but is not guaranteed to be accurate and should be independently verified.
![]() All information should be verified by the recipient and none is guaranteed as accurate by ARMLS
All information should be verified by the recipient and none is guaranteed as accurate by ARMLS
Listing Information presented by local MLS brokerage: Ten-X, local REALTOR®- Arlene Richardson - (888)-952-6393