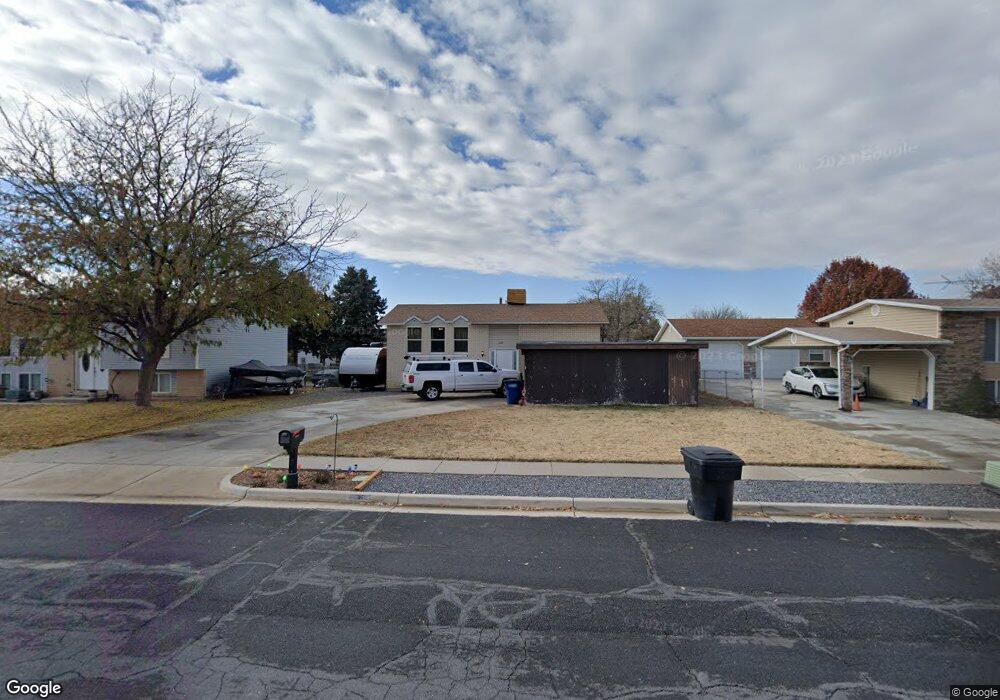
2669 N 1325 W Clearfield, UT 84015
Estimated Value: $398,000 - $421,000
4
Beds
2
Baths
2,020
Sq Ft
$203/Sq Ft
Est. Value
About This Home
This home is located at 2669 N 1325 W, Clearfield, UT 84015 and is currently estimated at $409,604, approximately $202 per square foot. 2669 N 1325 W is a home located in Davis County with nearby schools including Parkside Elementary School, Sunset Junior High School, and Clearfield High School.
Ownership History
Date
Name
Owned For
Owner Type
Purchase Details
Closed on
Oct 26, 2012
Sold by
Smith Jacob Andrew
Bought by
Smith Sara B and Smith Jacob A
Current Estimated Value
Home Financials for this Owner
Home Financials are based on the most recent Mortgage that was taken out on this home.
Original Mortgage
$101,750
Outstanding Balance
$69,590
Interest Rate
3.25%
Mortgage Type
FHA
Estimated Equity
$340,014
Purchase Details
Closed on
Nov 17, 2000
Sold by
Countrywide Home Loans
Bought by
Hud
Purchase Details
Closed on
Oct 16, 2000
Sold by
Rone Eldy R and Banks Diana K
Bought by
Countrywide Home Loans Inc
Purchase Details
Closed on
Jun 20, 1997
Sold by
Medina Albert J and Medina Maxine
Bought by
Rone Eldy R and Banks Diana K
Home Financials for this Owner
Home Financials are based on the most recent Mortgage that was taken out on this home.
Original Mortgage
$109,305
Interest Rate
7.94%
Mortgage Type
FHA
Create a Home Valuation Report for This Property
The Home Valuation Report is an in-depth analysis detailing your home's value as well as a comparison with similar homes in the area
Home Values in the Area
Average Home Value in this Area
Purchase History
| Date | Buyer | Sale Price | Title Company |
|---|---|---|---|
| Smith Sara B | -- | Inwest Title Services | |
| Hud | -- | First American Title Co | |
| Countrywide Home Loans Inc | $116,547 | First American Title Co | |
| Rone Eldy R | -- | U S Title |
Source: Public Records
Mortgage History
| Date | Status | Borrower | Loan Amount |
|---|---|---|---|
| Open | Smith Sara B | $101,750 | |
| Previous Owner | Rone Eldy R | $109,305 |
Source: Public Records
Tax History Compared to Growth
Tax History
| Year | Tax Paid | Tax Assessment Tax Assessment Total Assessment is a certain percentage of the fair market value that is determined by local assessors to be the total taxable value of land and additions on the property. | Land | Improvement |
|---|---|---|---|---|
| 2025 | $2,116 | $203,500 | $87,533 | $115,967 |
| 2024 | $2,071 | $200,199 | $96,503 | $103,696 |
| 2023 | $1,895 | $186,450 | $60,112 | $126,337 |
| 2022 | $2,007 | $361,000 | $122,678 | $238,322 |
| 2021 | $1,860 | $273,000 | $83,426 | $189,574 |
| 2020 | $1,611 | $234,000 | $70,341 | $163,659 |
| 2019 | $1,522 | $216,000 | $83,216 | $132,784 |
| 2018 | $1,406 | $196,000 | $70,420 | $125,580 |
| 2016 | $1,300 | $93,555 | $27,307 | $66,248 |
| 2015 | $1,191 | $81,510 | $27,307 | $54,203 |
| 2014 | $1,135 | $78,889 | $27,307 | $51,582 |
| 2013 | -- | $75,860 | $25,230 | $50,630 |
Source: Public Records
Map
Nearby Homes