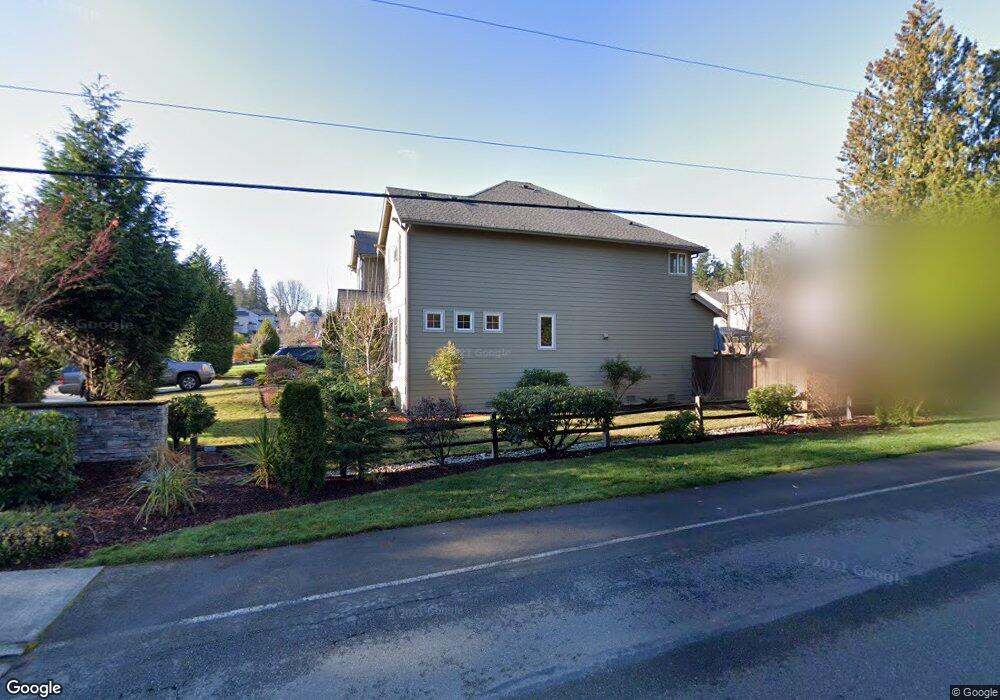
2669 NE Noll Valley Loop Poulsbo, WA 98370
Estimated Value: $819,000 - $893,000
4
Beds
3
Baths
3,357
Sq Ft
$250/Sq Ft
Est. Value
About This Home
This home is located at 2669 NE Noll Valley Loop, Poulsbo, WA 98370 and is currently estimated at $839,965, approximately $250 per square foot. 2669 NE Noll Valley Loop is a home located in Kitsap County with nearby schools including Poulsbo Elementary School, Poulsbo Middle School, and North Kitsap High School.
Ownership History
Date
Name
Owned For
Owner Type
Purchase Details
Closed on
Dec 28, 2010
Sold by
Ferguson Derry M and Ferguson Jennifer M
Bought by
Ferguson Keith A and Miller Michelle
Current Estimated Value
Home Financials for this Owner
Home Financials are based on the most recent Mortgage that was taken out on this home.
Original Mortgage
$413,200
Outstanding Balance
$275,713
Interest Rate
4.34%
Mortgage Type
VA
Estimated Equity
$564,252
Purchase Details
Closed on
Oct 29, 2009
Sold by
Noll Valley Llc
Bought by
Ferguson Derry M and Ferguson Jennifer M
Home Financials for this Owner
Home Financials are based on the most recent Mortgage that was taken out on this home.
Original Mortgage
$481,075
Interest Rate
4.5%
Mortgage Type
FHA
Create a Home Valuation Report for This Property
The Home Valuation Report is an in-depth analysis detailing your home's value as well as a comparison with similar homes in the area
Home Values in the Area
Average Home Value in this Area
Purchase History
| Date | Buyer | Sale Price | Title Company |
|---|---|---|---|
| Ferguson Keith A | $400,280 | Pacific Nw Title | |
| Ferguson Derry M | $490,230 | Land Title |
Source: Public Records
Mortgage History
| Date | Status | Borrower | Loan Amount |
|---|---|---|---|
| Open | Ferguson Keith A | $413,200 | |
| Previous Owner | Ferguson Derry M | $481,075 |
Source: Public Records
Tax History Compared to Growth
Tax History
| Year | Tax Paid | Tax Assessment Tax Assessment Total Assessment is a certain percentage of the fair market value that is determined by local assessors to be the total taxable value of land and additions on the property. | Land | Improvement |
|---|---|---|---|---|
| 2026 | $6,862 | $779,960 | $119,450 | $660,510 |
| 2025 | $6,862 | $779,960 | $119,450 | $660,510 |
| 2024 | $6,815 | $798,480 | $111,700 | $686,780 |
| 2023 | $6,931 | $798,480 | $111,700 | $686,780 |
| 2022 | $6,116 | $671,150 | $96,960 | $574,190 |
| 2021 | $5,910 | $601,030 | $86,880 | $514,150 |
| 2020 | $5,747 | $574,630 | $83,000 | $491,630 |
| 2019 | $5,389 | $539,180 | $77,570 | $461,610 |
| 2018 | $5,129 | $436,360 | $58,930 | $377,430 |
| 2017 | $4,890 | $436,360 | $58,930 | $377,430 |
| 2016 | $4,983 | $409,400 | $58,930 | $350,470 |
| 2015 | $4,792 | $395,920 | $58,930 | $336,990 |
| 2014 | -- | $377,050 | $58,930 | $318,120 |
| 2013 | -- | $377,050 | $58,930 | $318,120 |
Source: Public Records
Map
Nearby Homes
- 2776 NE Noll Valley Loop
- 19680 Noll Rd NE
- 19546 23rd Ave NE
- 1776 Bungalow Way NE
- 123 Pugh Rd NE
- 1754 NE Mesford Rd Unit 74
- 29 Beargrass Ln NE
- 35 Beargrass Ln NE
- 2413 NE Sunnymede St
- 19328 Widme Rd NE
- 2405 NE Waterlily Way
- 0 Bond Rd NE
- 18552 15th Loop NE
- 20249 State Highway 305 NE
- 456 Little Valley Rd NE
- 18130 Sunrise Ridge Ave NE
- 1610 NE Mount Kamela Ct
- 20156 Vikings Crest NE Unit 7-304
- 20161 Vikings Crest Loop NE Unit 5-106
- 20050 Vikings Crest Loop NE Unit 2-301
- 2675 NE Noll Valley Loop
- 2783 NE Noll Valley Loop
- 2681 NE Noll Valley Loop
- 2777 NE Noll Valley Loop
- 2614 NE Noll Valley Loop
- 2620 NE Noll Valley Loop
- 2687 NE Noll Valley Loop
- 2626 NE Noll Valley Loop
- 2765 NE Noll Valley Loop
- 2632 NE Noll Valley Loop
- 2693 NE Noll Valley Loop
- 2782 NE Noll Valley Loop
- 2759 NE Noll Valley Loop
- 19949 Noll Rd NE
- 2770 NE Noll Valley Loop
- 19943 Noll Rd NE
- 2699 NE Noll Valley Loop
- 19947 Noll Rd NE
- 2764 NE Noll Valley Loop
- 2753 NE Noll Valley Loop