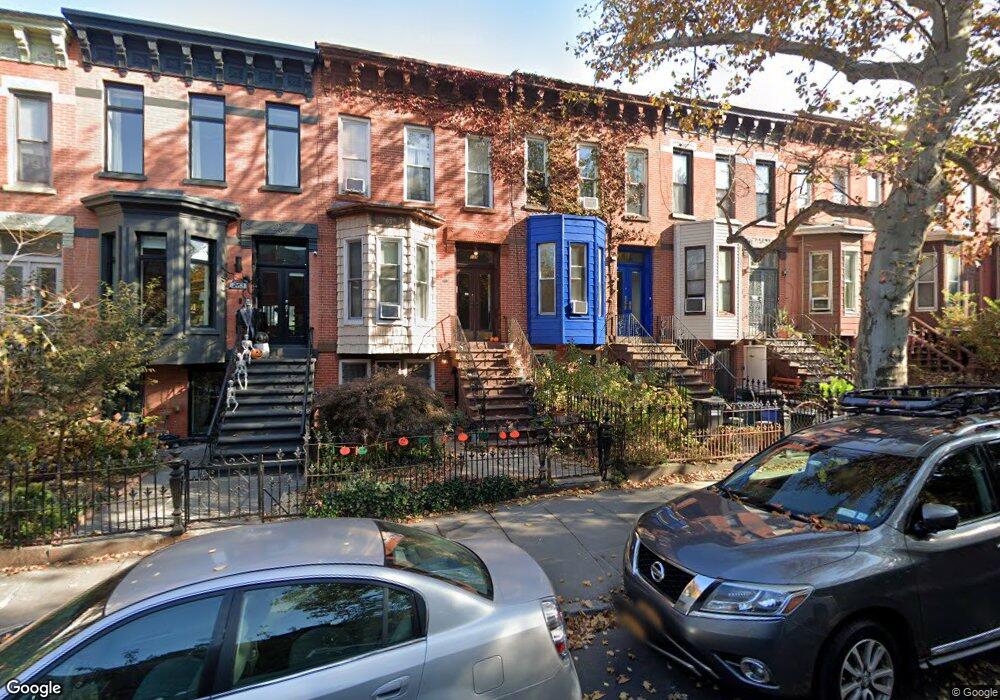
267 11th St Unit 2 Brooklyn, NY 11215
South Slope NeighborhoodEstimated Value: $1,795,239 - $2,496,000
Studio
1
Bath
1,968
Sq Ft
$1,157/Sq Ft
Est. Value
About This Home
This home is located at 267 11th St Unit 2, Brooklyn, NY 11215 and is currently estimated at $2,276,310, approximately $1,156 per square foot. 267 11th St Unit 2 is a home located in Kings County with nearby schools including P.S. 124 Silas B Dutcher and Hellenic Classical Charter School - Park Slope.
Ownership History
Date
Name
Owned For
Owner Type
Purchase Details
Closed on
Oct 1, 2003
Sold by
Grannis Aenne
Bought by
Aharoni Yifat and Zilberstein Marius
Current Estimated Value
Home Financials for this Owner
Home Financials are based on the most recent Mortgage that was taken out on this home.
Original Mortgage
$541,000
Interest Rate
5.62%
Mortgage Type
Purchase Money Mortgage
Purchase Details
Closed on
Jul 2, 2001
Sold by
Pflaum William
Bought by
Pflaum William and Grannis Aenne
Home Financials for this Owner
Home Financials are based on the most recent Mortgage that was taken out on this home.
Original Mortgage
$1,253
Interest Rate
7.18%
Purchase Details
Closed on
Mar 15, 2001
Sold by
Grannis Susanna W
Bought by
Pflaum William
Purchase Details
Closed on
Apr 14, 1999
Sold by
Dowling Michael S
Bought by
Grannis Susanna W and Grannis Joseph C
Home Financials for this Owner
Home Financials are based on the most recent Mortgage that was taken out on this home.
Original Mortgage
$307,000
Interest Rate
7.49%
Create a Home Valuation Report for This Property
The Home Valuation Report is an in-depth analysis detailing your home's value as well as a comparison with similar homes in the area
Home Values in the Area
Average Home Value in this Area
Purchase History
| Date | Buyer | Sale Price | Title Company |
|---|---|---|---|
| Aharoni Yifat | $833,000 | -- | |
| Pflaum William | -- | -- | |
| Pflaum William | $260,000 | Lawyers Title Insurance Corp | |
| Grannis Susanna W | $395,000 | -- |
Source: Public Records
Mortgage History
| Date | Status | Borrower | Loan Amount |
|---|---|---|---|
| Previous Owner | Aharoni Yifat | $541,000 | |
| Previous Owner | Pflaum William | $1,253 | |
| Previous Owner | Grannis Susanna W | $307,000 | |
| Closed | Aharoni Yifat | $200,000 |
Source: Public Records
Tax History
| Year | Tax Paid | Tax Assessment Tax Assessment Total Assessment is a certain percentage of the fair market value that is determined by local assessors to be the total taxable value of land and additions on the property. | Land | Improvement |
|---|---|---|---|---|
| 2025 | $6,541 | $141,240 | $24,540 | $116,700 |
| 2024 | $6,541 | $141,060 | $24,540 | $116,520 |
| 2023 | $6,264 | $154,380 | $24,540 | $129,840 |
| 2022 | $5,807 | $129,660 | $24,540 | $105,120 |
| 2021 | $6,128 | $135,480 | $24,540 | $110,940 |
| 2020 | $2,988 | $136,980 | $24,540 | $112,440 |
| 2019 | $5,628 | $141,720 | $24,540 | $117,180 |
| 2018 | $5,180 | $26,872 | $4,797 | $22,075 |
| 2017 | $4,886 | $25,437 | $4,956 | $20,481 |
| 2016 | $4,775 | $25,437 | $5,058 | $20,379 |
| 2015 | $2,675 | $24,980 | $7,458 | $17,522 |
| 2014 | $2,675 | $23,588 | $8,451 | $15,137 |
Source: Public Records
Map
Nearby Homes
- 266 10th St Unit 2
- 266 10th St Unit 1
- 266 10th St Unit 3
- 232 12th St
- 500 4th Ave Unit 6O
- 500 4th Ave Unit 11C
- 500 4th Ave Unit 4D
- 211 13th St
- 185 12th St
- 229 9th St Unit 206
- 229 9th St Unit 307
- 187 13th St Unit 1-A
- 183A 13th St Unit 1A
- 185 13th St Unit 3B
- 174 12th St
- 175 12th St Unit 2B
- 228 13th St Unit 201
- 167 13th St Unit 1
- 161 12th St Unit 3B
- 445 5th Ave Unit 5-B
Your Personal Tour Guide
Ask me questions while you tour the home.