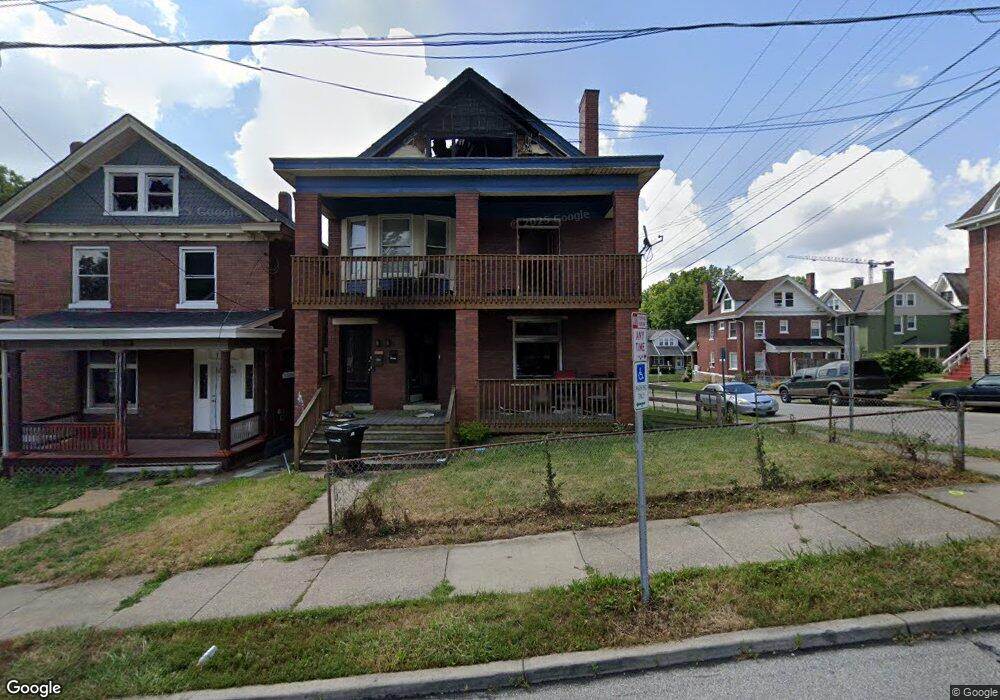
267 Bodmann Ave Cincinnati, OH 45219
Mount Auburn NeighborhoodEstimated Value: $241,203 - $383,000
4
Beds
2
Baths
2,068
Sq Ft
$149/Sq Ft
Est. Value
About This Home
This home is located at 267 Bodmann Ave, Cincinnati, OH 45219 and is currently estimated at $308,068, approximately $148 per square foot. 267 Bodmann Ave is a home located in Hamilton County with nearby schools including William H. Taft Elementary School, Robert A. Taft Information Technology High School, and Gilbert A. Dater High School.
Ownership History
Date
Name
Owned For
Owner Type
Purchase Details
Closed on
Jul 17, 2015
Sold by
Mitchell Carlos
Bought by
My Three
Current Estimated Value
Purchase Details
Closed on
Jun 17, 2011
Sold by
Kelly Jovan Oc and Kelly Demeritia K
Bought by
Mitchell Carlos
Purchase Details
Closed on
Apr 19, 2007
Sold by
Walker Jimmie Clay and Walker Rodney A
Bought by
Kelly Jovan O C
Purchase Details
Closed on
Mar 16, 2007
Sold by
Estate Of Cameron E Austin
Bought by
Austin George
Purchase Details
Closed on
Mar 15, 2007
Sold by
Austin George
Bought by
Walker Jimmie Clay
Purchase Details
Closed on
Mar 5, 2007
Sold by
Estate Of Eunice Moorman
Bought by
Moorman Thomas
Purchase Details
Closed on
Jan 4, 2007
Sold by
Moorman Thomas
Bought by
Walker Jimmie Clay
Purchase Details
Closed on
Sep 26, 2006
Sold by
Estate Of Sandra Walker
Bought by
Austin Cameron E
Create a Home Valuation Report for This Property
The Home Valuation Report is an in-depth analysis detailing your home's value as well as a comparison with similar homes in the area
Home Values in the Area
Average Home Value in this Area
Purchase History
| Date | Buyer | Sale Price | Title Company |
|---|---|---|---|
| My Three | $12,500 | None Available | |
| Mitchell Carlos | $50,000 | Attorney | |
| Kelly Jovan O C | $15,000 | C&R Title Agency Inc | |
| Austin George | -- | Attorney | |
| Walker Jimmie Clay | $507 | Attorney | |
| Moorman Thomas | -- | Attorney | |
| Walker Jimmie Clay | -- | Attorney | |
| Austin Cameron E | -- | Attorney |
Source: Public Records
Tax History
| Year | Tax Paid | Tax Assessment Tax Assessment Total Assessment is a certain percentage of the fair market value that is determined by local assessors to be the total taxable value of land and additions on the property. | Land | Improvement |
|---|---|---|---|---|
| 2025 | $1,933 | $10,080 | $10,080 | -- |
| 2024 | $3,475 | $54,299 | $10,080 | $44,219 |
| 2023 | $3,481 | $54,299 | $10,080 | $44,219 |
| 2022 | $1,866 | $25,890 | $5,747 | $20,143 |
| 2021 | $1,822 | $25,890 | $5,747 | $20,143 |
| 2020 | $1,827 | $25,890 | $5,747 | $20,143 |
| 2019 | $1,761 | $22,708 | $5,040 | $17,668 |
| 2018 | $1,763 | $22,708 | $5,040 | $17,668 |
| 2017 | $1,696 | $22,708 | $5,040 | $17,668 |
| 2016 | $1,398 | $18,201 | $5,023 | $13,178 |
| 2015 | $1,252 | $18,201 | $5,023 | $13,178 |
| 2014 | $1,259 | $18,201 | $5,023 | $13,178 |
| 2013 | $1,231 | $17,500 | $4,830 | $12,670 |
Source: Public Records
Map
Nearby Homes
- 295 Dorchester Ave
- 224 Dorchester Ave
- 2014 Highland Ave
- 1948 Bigelow St
- 1944 Bigelow St
- 1940 Bigelow St
- 1938 Bigelow St
- 1942 Bigelow St
- 1946 Bigelow St
- 336 Dorchester Ave
- 2117 Highland Ave
- 540 Slack St
- 2124 Highland Ave
- 548 Slack St
- 164 Dorchester Ave
- 1883 Walker St
- 152 Dorchester Ave
- 1863 Walker St
- 136 Dorchester Ave
- 1825 Walker St
- 271 Bodmann Ave
- 275 Bodmann Ave
- 259 Bodmann Ave
- 257 Bodmann Ave
- 266 Dorchester Ave
- 270 Dorchester Ave
- 279 Bodmann Ave
- 274 Dorchester Ave
- 253 Bodmann Ave
- 258 Dorchester Ave
- 258 Dorchester Ave Unit SI ID1056079P
- 258 Dorchester Ave Unit ID1056079P
- 283 Bodmann Ave
- 278 Dorchester Ave
- 270 Bodmann Ave
- 274 Bodmann Ave
- 254 Dorchester Ave
- 251 Bodmann Ave
- 287 Bodmann Ave
- 282 Dorchester Ave
Your Personal Tour Guide
Ask me questions while you tour the home.