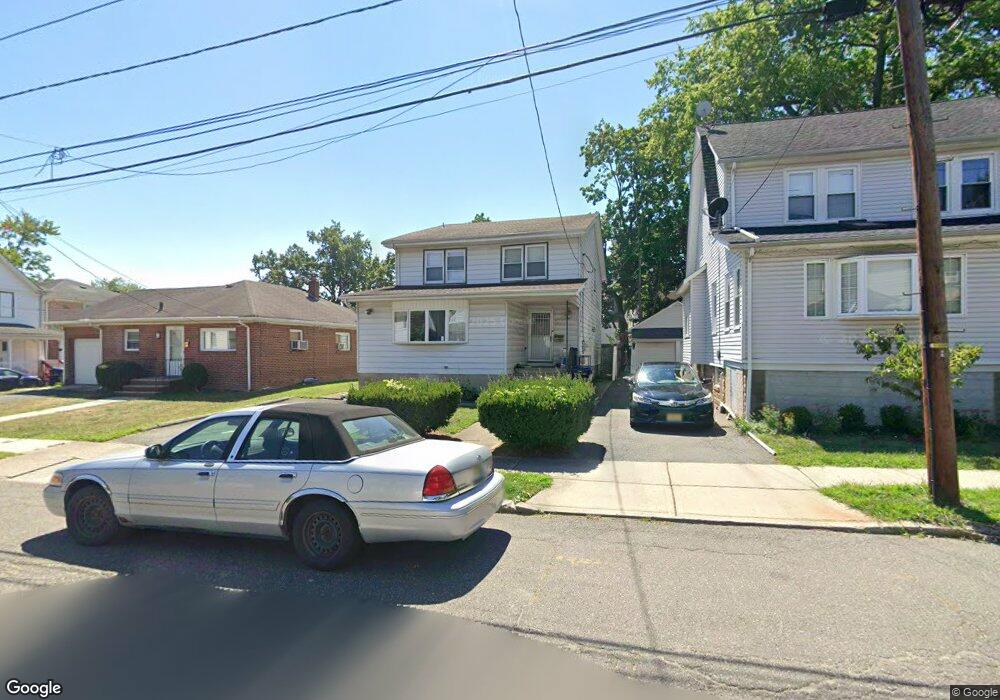
267 Clay St Hackensack, NJ 07601
Estimated Value: $488,000 - $722,000
Studio
--
Bath
2,393
Sq Ft
$261/Sq Ft
Est. Value
About This Home
This home is located at 267 Clay St, Hackensack, NJ 07601 and is currently estimated at $623,984, approximately $260 per square foot. 267 Clay St is a home located in Bergen County with nearby schools including Hackensack High School and Bergen County Christian Academy.
Ownership History
Date
Name
Owned For
Owner Type
Purchase Details
Closed on
Feb 25, 2009
Sold by
Hornung Kevin
Bought by
Gaines Bernadette Carol and Gaines Curtis
Current Estimated Value
Home Financials for this Owner
Home Financials are based on the most recent Mortgage that was taken out on this home.
Original Mortgage
$231,939
Outstanding Balance
$147,872
Interest Rate
5.18%
Mortgage Type
Purchase Money Mortgage
Estimated Equity
$476,112
Purchase Details
Closed on
Nov 17, 2006
Sold by
Somervil Maria Pardo Nka Maria
Bought by
Hornung Kevin
Purchase Details
Closed on
Aug 31, 2004
Sold by
Williams David
Bought by
Rivera Minerva and Somerville Maria
Home Financials for this Owner
Home Financials are based on the most recent Mortgage that was taken out on this home.
Original Mortgage
$292,000
Interest Rate
6.02%
Purchase Details
Closed on
Jan 15, 2004
Sold by
Williams Sandy
Bought by
Williams David
Home Financials for this Owner
Home Financials are based on the most recent Mortgage that was taken out on this home.
Original Mortgage
$318,600
Interest Rate
6.02%
Create a Home Valuation Report for This Property
The Home Valuation Report is an in-depth analysis detailing your home's value as well as a comparison with similar homes in the area
Home Values in the Area
Average Home Value in this Area
Purchase History
| Date | Buyer | Sale Price | Title Company |
|---|---|---|---|
| Gaines Bernadette Carol | $235,000 | -- | |
| Hornung Kevin | $470,000 | -- | |
| Rivera Minerva | $365,000 | -- | |
| Williams David | $354,000 | -- |
Source: Public Records
Mortgage History
| Date | Status | Borrower | Loan Amount |
|---|---|---|---|
| Open | Gaines Bernadette Carol | $231,939 | |
| Previous Owner | Rivera Minerva | $292,000 | |
| Previous Owner | Williams David | $318,600 |
Source: Public Records
Tax History
| Year | Tax Paid | Tax Assessment Tax Assessment Total Assessment is a certain percentage of the fair market value that is determined by local assessors to be the total taxable value of land and additions on the property. | Land | Improvement |
|---|---|---|---|---|
| 2025 | $10,091 | $330,200 | $132,500 | $197,700 |
| 2024 | $9,506 | $330,200 | $132,500 | $197,700 |
| 2023 | $8,913 | $330,200 | $132,500 | $197,700 |
| 2022 | $8,913 | $318,100 | $121,600 | $196,500 |
| 2021 | $8,546 | $254,500 | $98,500 | $156,000 |
| 2020 | $8,421 | $254,500 | $98,500 | $156,000 |
| 2019 | $8,409 | $250,500 | $97,000 | $153,500 |
| 2018 | $8,423 | $246,800 | $94,500 | $152,300 |
| 2017 | $8,292 | $242,800 | $93,000 | $149,800 |
| 2016 | $7,783 | $230,400 | $83,000 | $147,400 |
| 2015 | $9,195 | $262,700 | $121,600 | $141,100 |
| 2014 | $8,727 | $262,700 | $121,600 | $141,100 |
Source: Public Records
Map
Nearby Homes
- 298 3rd St
- 280 Prospect Ave Unit 9H
- 280 Prospect Ave Unit 11H
- 280 Prospect Ave Unit 5D
- 280 Prospect Ave Unit 6J
- 280 Prospect Ave Unit 3N
- 245 Prospect Ave Unit 5B
- 245 Prospect Ave Unit 12B
- 245 Prospect Ave Unit 14D
- 277 Prospect Ave Unit 11H
- 277 Prospect Ave Unit 4A
- 277 Prospect Ave Unit 14B
- 277 Prospect Ave Unit 18B
- 277 Prospect Ave Unit 18H
- 326 Prospect Ave Unit 8E
- 326 Prospect Ave Unit 6J
- 326 Prospect Ave Unit 12A
- 326 Prospect Ave Unit 10H
- 316 Prospect Ave Unit 8D
- 316 Prospect Ave Unit 8H
Your Personal Tour Guide
Ask me questions while you tour the home.