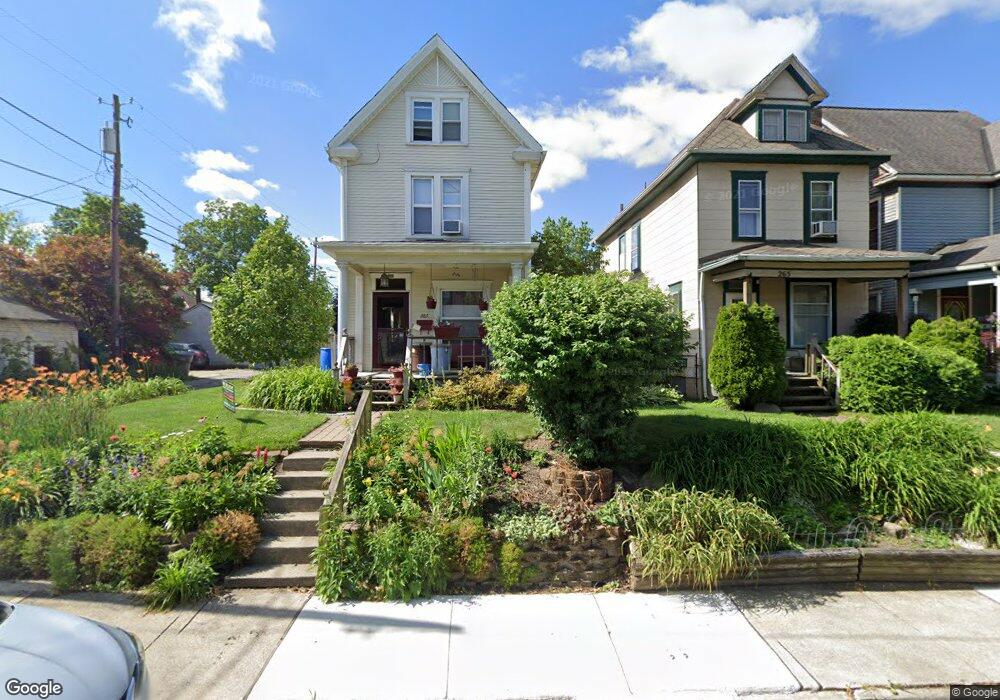
267 E Blake Ave Columbus, OH 43202
Old North Columbus NeighborhoodEstimated Value: $303,000 - $362,001
3
Beds
1
Bath
1,781
Sq Ft
$183/Sq Ft
Est. Value
About This Home
This home is located at 267 E Blake Ave, Columbus, OH 43202 and is currently estimated at $326,250, approximately $183 per square foot. 267 E Blake Ave is a home located in Franklin County with nearby schools including Hubbard Elementary School, Dominion Middle School, and Whetstone High School.
Ownership History
Date
Name
Owned For
Owner Type
Purchase Details
Closed on
Oct 20, 2000
Sold by
Choi Smauel K
Bought by
Harger Tracy L
Current Estimated Value
Home Financials for this Owner
Home Financials are based on the most recent Mortgage that was taken out on this home.
Original Mortgage
$85,200
Outstanding Balance
$29,372
Interest Rate
7.91%
Estimated Equity
$296,878
Purchase Details
Closed on
Jun 29, 1998
Sold by
Miller Amy M and Miller Daniel C
Bought by
Choi Samuel K
Home Financials for this Owner
Home Financials are based on the most recent Mortgage that was taken out on this home.
Original Mortgage
$79,700
Interest Rate
7.03%
Purchase Details
Closed on
Jun 5, 1995
Sold by
Messer Debra J
Bought by
Miller Amy M and Miller Daniel C
Purchase Details
Closed on
Jan 1, 1984
Create a Home Valuation Report for This Property
The Home Valuation Report is an in-depth analysis detailing your home's value as well as a comparison with similar homes in the area
Home Values in the Area
Average Home Value in this Area
Purchase History
| Date | Buyer | Sale Price | Title Company |
|---|---|---|---|
| Harger Tracy L | $106,900 | Huntington Title Services | |
| Choi Samuel K | $82,000 | Chicago Title | |
| Miller Amy M | $69,500 | -- | |
| -- | $37,500 | -- |
Source: Public Records
Mortgage History
| Date | Status | Borrower | Loan Amount |
|---|---|---|---|
| Open | Harger Tracy L | $85,200 | |
| Previous Owner | Choi Samuel K | $79,700 | |
| Closed | Choi Samuel K | $3,000 |
Source: Public Records
Tax History
| Year | Tax Paid | Tax Assessment Tax Assessment Total Assessment is a certain percentage of the fair market value that is determined by local assessors to be the total taxable value of land and additions on the property. | Land | Improvement |
|---|---|---|---|---|
| 2025 | $5,379 | $119,850 | $27,410 | $92,440 |
| 2024 | $5,379 | $119,850 | $27,410 | $92,440 |
| 2023 | $5,310 | $119,840 | $27,405 | $92,435 |
| 2022 | $4,085 | $78,760 | $16,420 | $62,340 |
| 2021 | $4,092 | $78,760 | $16,420 | $62,340 |
| 2020 | $4,097 | $78,760 | $16,420 | $62,340 |
| 2019 | $3,822 | $63,010 | $13,130 | $49,880 |
| 2018 | $3,247 | $63,010 | $13,130 | $49,880 |
| 2017 | $3,820 | $63,010 | $13,130 | $49,880 |
| 2016 | $2,952 | $44,560 | $6,370 | $38,190 |
| 2015 | $2,680 | $44,560 | $6,370 | $38,190 |
| 2014 | $2,686 | $44,560 | $6,370 | $38,190 |
| 2013 | $1,204 | $40,495 | $5,775 | $34,720 |
Source: Public Records
Map
Nearby Homes
- 2343 Indianola Ave
- 210 E Blake Ave
- 2362 Indiana Ave
- 2458- 2458 1 2 Deming Ave
- 2395 Summit St Unit 397
- 2478-2480 Deming Ave
- 2470 Indianola Ave
- 2295 N 4th St
- 68 E Oakland Ave
- 23 E Maynard Ave
- 2210-2212 N 4th St
- 525-527 E Tompkins St
- 2555 Glenmawr Ave
- 6 E Blake Ave
- 2539 N 4th St Unit 539
- 9 E Norwich Ave Unit 15
- 2082 N 4th St
- 415 Glen Echo Cir
- 2604 N 4th St
- 2717 Hibbert Ave
- 263 E Blake Ave
- 259 E Blake Ave
- 2349 Indianola Ave
- 255 E Blake Ave
- 2353 Indianola Ave
- 2339 Indianola Ave
- 251 E Blake Ave
- 260 E Maynard Ave Unit 262
- 258 E Maynard Ave
- 2335 Indianola Ave
- 247 E Blake Ave
- 2363 Indianola Ave
- 250 E Maynard Ave
- 268 E Blake Ave
- 252 E Maynard Ave
- 2329 Indianola Ave
- 266 E Blake Ave
- 262 E Blake Ave
- 2369 Indianola Ave
- 246 E Maynard Ave
Your Personal Tour Guide
Ask me questions while you tour the home.