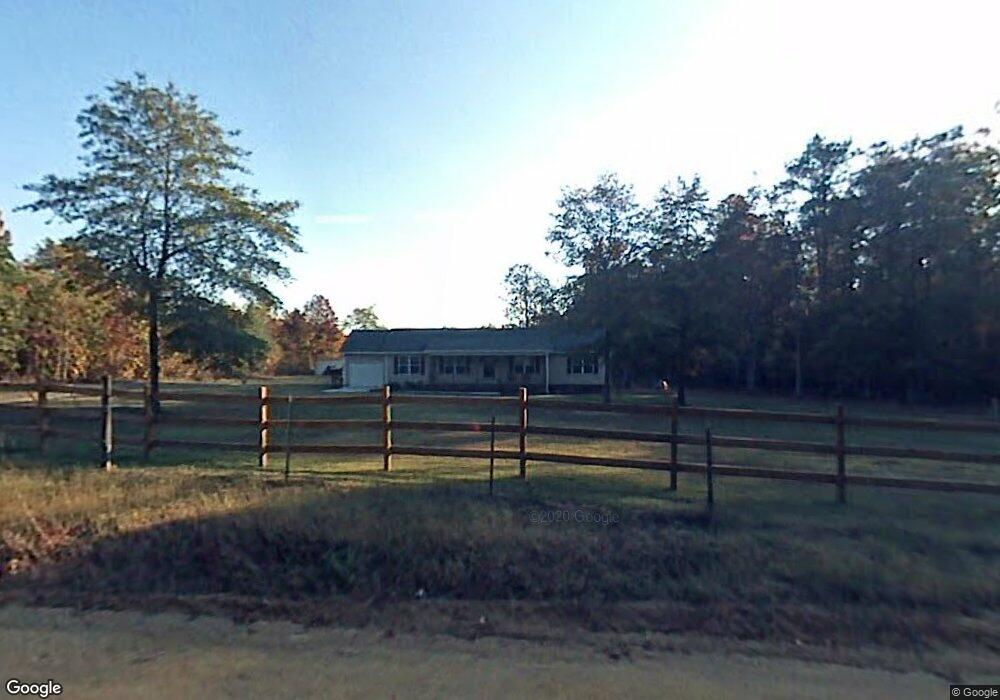
267 Fallaws Ln Batesburg, SC 29006
Estimated Value: $314,444 - $324,000
3
Beds
2
Baths
1,638
Sq Ft
$194/Sq Ft
Est. Value
About This Home
This home is located at 267 Fallaws Ln, Batesburg, SC 29006 and is currently estimated at $318,361, approximately $194 per square foot. 267 Fallaws Ln is a home located in Lexington County with nearby schools including Batesburg-Leesville Primary School, Batesburg-Leesville Elementary School, and Batesburg-Leesville Middle School.
Ownership History
Date
Name
Owned For
Owner Type
Purchase Details
Closed on
Sep 30, 2024
Sold by
Nelson Kevin L
Bought by
Milliken Daniel Newell and Milliken Tiffany Lynn
Current Estimated Value
Home Financials for this Owner
Home Financials are based on the most recent Mortgage that was taken out on this home.
Original Mortgage
$306,839
Outstanding Balance
$303,698
Interest Rate
6.49%
Mortgage Type
FHA
Estimated Equity
$14,663
Purchase Details
Closed on
Sep 20, 2019
Sold by
Frankhouse Jeffrey L and Frankhouse Amanda E
Bought by
Nelson Kevin L
Purchase Details
Closed on
May 18, 2012
Sold by
Dearman Michael R
Bought by
Frankhouse Jeffrey L and Frankhouse Amanda E
Home Financials for this Owner
Home Financials are based on the most recent Mortgage that was taken out on this home.
Original Mortgage
$163,010
Interest Rate
3.9%
Mortgage Type
Future Advance Clause Open End Mortgage
Purchase Details
Closed on
Sep 8, 2006
Sold by
Mnsco Inc
Bought by
Dearman Michael R
Create a Home Valuation Report for This Property
The Home Valuation Report is an in-depth analysis detailing your home's value as well as a comparison with similar homes in the area
Home Values in the Area
Average Home Value in this Area
Purchase History
| Date | Buyer | Sale Price | Title Company |
|---|---|---|---|
| Milliken Daniel Newell | $312,500 | None Listed On Document | |
| Nelson Kevin L | $199,600 | None Available | |
| Frankhouse Jeffrey L | $159,750 | -- | |
| Dearman Michael R | $18,000 | None Available |
Source: Public Records
Mortgage History
| Date | Status | Borrower | Loan Amount |
|---|---|---|---|
| Open | Milliken Daniel Newell | $306,839 | |
| Previous Owner | Frankhouse Jeffrey L | $163,010 |
Source: Public Records
Tax History Compared to Growth
Tax History
| Year | Tax Paid | Tax Assessment Tax Assessment Total Assessment is a certain percentage of the fair market value that is determined by local assessors to be the total taxable value of land and additions on the property. | Land | Improvement |
|---|---|---|---|---|
| 2024 | $1,218 | $7,984 | $1,440 | $6,544 |
| 2023 | $1,218 | $7,984 | $1,440 | $6,544 |
| 2022 | $1,219 | $7,984 | $1,440 | $6,544 |
| 2020 | $1,016 | $7,984 | $1,440 | $6,544 |
| 2019 | $778 | $5,455 | $864 | $4,591 |
| 2018 | $730 | $5,455 | $864 | $4,591 |
| 2017 | $672 | $5,455 | $864 | $4,591 |
| 2016 | $528 | $5,454 | $864 | $4,590 |
| 2014 | $651 | $6,389 | $864 | $5,525 |
| 2013 | -- | $6,390 | $860 | $5,530 |
Source: Public Records
Map
Nearby Homes
- 104 Merlot Ct
- 102 Burgundy Ct
- 0 Hanahan Ln
- 0 Scrimshaw Rd
- 303 Nell St
- 326 Nell St
- 1016 Willis St
- 115 Henry St
- 00 Olive Branch Terrace
- 0 Line St Unit 23634336
- TBD Liberty St
- 331 Thomas St
- 212 Eddie St
- 214 Magnolia St
- 411 Wilson St
- 209 E Columbia Ave
- 0 Forest Dr
- 401 Terrace Way
- 307 E Columbia Ave
- 0 Hendrix St
- 247 Fallaws Ln
- 255 Fallaws Ln
- 241 Fallaws Ln
- 241 Fallaws Ln
- 213 Fallaws Ln
- 0 Lester Parrish Rd
- 115 Fallaws Ln
- 311 W L Cameron Rd
- 212 W L Cameron Rd
- 934 S Lee St
- 1004 S Lee St
- 112 Fallaws Ln
- 304 W L Cameron Rd
- 209 W L Cameron Rd
- 1000 S Lee St
- 935 S Lee St
- 318 W L Cameron Rd
- 7348 Fairview Rd
- 1003 S Lee St
- 7371 Fairview Rd