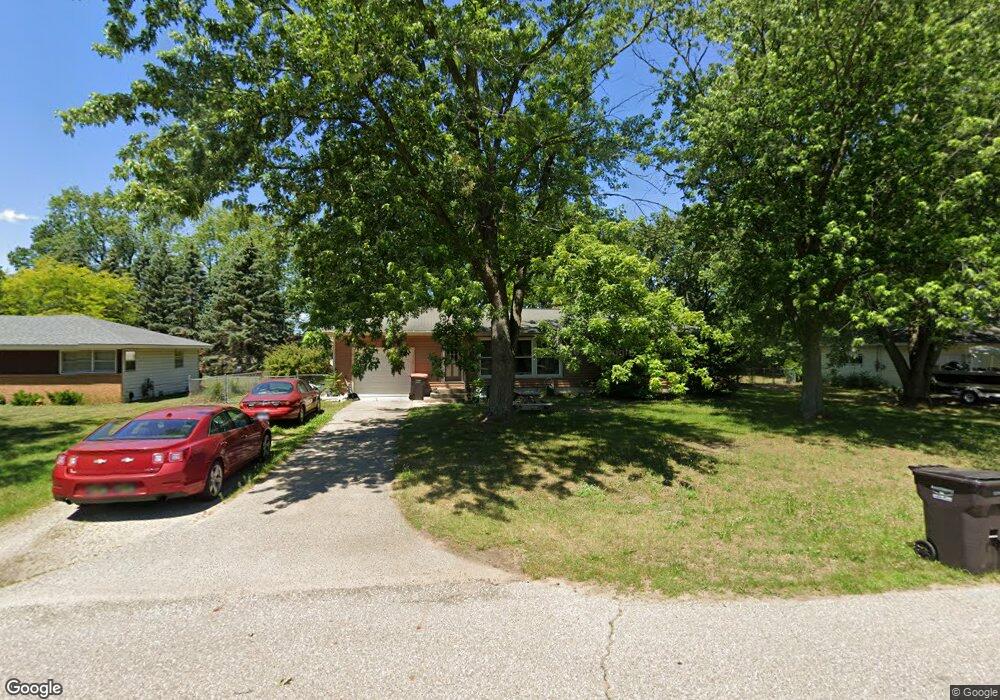
267 Franklin St Holland, MI 49424
Estimated Value: $268,000 - $291,000
3
Beds
1
Bath
1,450
Sq Ft
$194/Sq Ft
Est. Value
About This Home
This home is located at 267 Franklin St, Holland, MI 49424 and is currently estimated at $281,285, approximately $193 per square foot. 267 Franklin St is a home located in Ottawa County with nearby schools including Woodside Elementary School, Macatawa Bay Middle School, and West Ottawa High School.
Ownership History
Date
Name
Owned For
Owner Type
Purchase Details
Closed on
Nov 2, 2012
Sold by
Owen Bradley
Bought by
Owen Bradley and Owen Stacey
Current Estimated Value
Home Financials for this Owner
Home Financials are based on the most recent Mortgage that was taken out on this home.
Original Mortgage
$107,260
Outstanding Balance
$74,154
Interest Rate
3.4%
Mortgage Type
New Conventional
Estimated Equity
$207,131
Purchase Details
Closed on
Sep 28, 2007
Sold by
Garcia Javier and Garcia Juanita
Bought by
Owen Bradley
Home Financials for this Owner
Home Financials are based on the most recent Mortgage that was taken out on this home.
Original Mortgage
$111,000
Interest Rate
6.55%
Mortgage Type
Purchase Money Mortgage
Create a Home Valuation Report for This Property
The Home Valuation Report is an in-depth analysis detailing your home's value as well as a comparison with similar homes in the area
Home Values in the Area
Average Home Value in this Area
Purchase History
| Date | Buyer | Sale Price | Title Company |
|---|---|---|---|
| Owen Bradley | -- | Hbi Title Services Inc | |
| Owen Bradley | $111,000 | None Available |
Source: Public Records
Mortgage History
| Date | Status | Borrower | Loan Amount |
|---|---|---|---|
| Open | Owen Bradley | $107,260 | |
| Closed | Owen Bradley | $111,000 |
Source: Public Records
Tax History Compared to Growth
Tax History
| Year | Tax Paid | Tax Assessment Tax Assessment Total Assessment is a certain percentage of the fair market value that is determined by local assessors to be the total taxable value of land and additions on the property. | Land | Improvement |
|---|---|---|---|---|
| 2025 | $1,706 | $114,000 | $0 | $0 |
| 2024 | $1,292 | $109,300 | $0 | $0 |
| 2023 | $1,247 | $94,000 | $0 | $0 |
| 2022 | $1,615 | $74,800 | $0 | $0 |
| 2021 | $1,573 | $70,800 | $0 | $0 |
| 2020 | $1,503 | $65,900 | $0 | $0 |
| 2019 | $1,489 | $42,400 | $0 | $0 |
| 2018 | $1,372 | $56,400 | $14,000 | $42,400 |
| 2017 | $1,351 | $53,500 | $0 | $0 |
| 2016 | $1,343 | $50,500 | $0 | $0 |
| 2015 | $1,286 | $47,100 | $0 | $0 |
| 2014 | $1,286 | $43,700 | $0 | $0 |
Source: Public Records
Map
Nearby Homes
- 888 S Kingwood Ct
- 1020 Katra Ln Unit 52
- 257 Mae Rose Ave
- 125 Liberty St
- 790 Mayfield Ave
- 286 Felch St
- 901 Butternut Dr
- 13652 Signature Dr
- 13654 Signature Dr
- 14159 Pheasant Run
- 961 Shadybrook Dr
- 785 Mary Ave
- V/L Jack St
- 13182 Greenly St
- 14145 Carol St
- 13748 Quincy St
- 13785 Quincy St
- 14298 Carol St
- Integrity 1610 Plan at Silverwater
- Integrity 1250 Plan at Silverwater