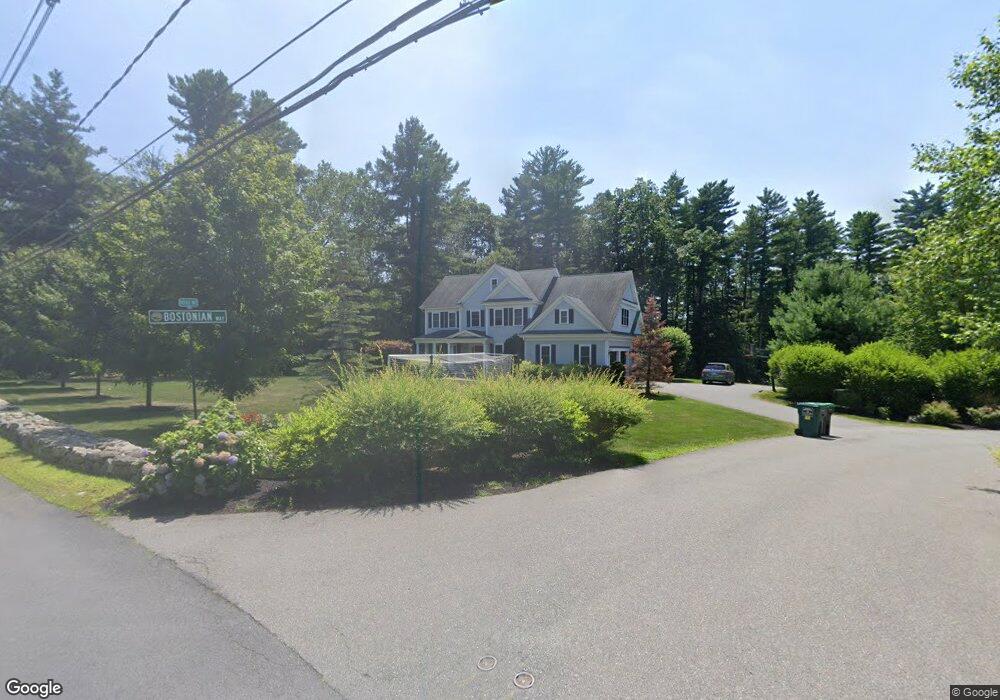
267 Goodmans Hill Rd Sudbury, MA 01776
Estimated Value: $1,698,648 - $2,017,000
4
Beds
4
Baths
3,294
Sq Ft
$580/Sq Ft
Est. Value
About This Home
This home is located at 267 Goodmans Hill Rd, Sudbury, MA 01776 and is currently estimated at $1,910,662, approximately $580 per square foot. 267 Goodmans Hill Rd is a home located in Middlesex County with nearby schools including Peter Noyes Elementary School, Ephraim Curtis Middle School, and Lincoln-Sudbury Regional High School.
Ownership History
Date
Name
Owned For
Owner Type
Purchase Details
Closed on
Jan 30, 2025
Sold by
Barber Thomas A and Barber Tamara
Bought by
Barber Ft and Barber
Current Estimated Value
Purchase Details
Closed on
Jun 12, 2015
Sold by
5Dwd Llc
Bought by
Barber Tamara and Barber Thomas A
Home Financials for this Owner
Home Financials are based on the most recent Mortgage that was taken out on this home.
Original Mortgage
$864,800
Interest Rate
3.65%
Mortgage Type
Purchase Money Mortgage
Purchase Details
Closed on
Sep 17, 2013
Sold by
Masterpiece Builders L
Bought by
5 Dwd Llc
Purchase Details
Closed on
Aug 1, 2006
Sold by
Millner-Hanley Dennis S and Millner-Hanley Wendy J
Bought by
Gazarian Frank R and Lento-Gazarian Karen
Home Financials for this Owner
Home Financials are based on the most recent Mortgage that was taken out on this home.
Original Mortgage
$302,400
Interest Rate
6.67%
Mortgage Type
Purchase Money Mortgage
Create a Home Valuation Report for This Property
The Home Valuation Report is an in-depth analysis detailing your home's value as well as a comparison with similar homes in the area
Home Values in the Area
Average Home Value in this Area
Purchase History
| Date | Buyer | Sale Price | Title Company |
|---|---|---|---|
| Barber Ft | -- | None Available | |
| Barber Ft | -- | None Available | |
| Barber Tamara | $1,081,000 | -- | |
| 5 Dwd Llc | -- | -- | |
| 5 Dwd Llc | -- | -- | |
| Gazarian Frank R | $432,000 | -- | |
| Gazarian Frank R | $432,000 | -- |
Source: Public Records
Mortgage History
| Date | Status | Borrower | Loan Amount |
|---|---|---|---|
| Previous Owner | Barber Tamara | $864,800 | |
| Previous Owner | Gazarian Frank R | $302,400 |
Source: Public Records
Tax History Compared to Growth
Tax History
| Year | Tax Paid | Tax Assessment Tax Assessment Total Assessment is a certain percentage of the fair market value that is determined by local assessors to be the total taxable value of land and additions on the property. | Land | Improvement |
|---|---|---|---|---|
| 2025 | $24,846 | $1,697,100 | $546,800 | $1,150,300 |
| 2024 | $23,902 | $1,636,000 | $530,800 | $1,105,200 |
| 2023 | $22,083 | $1,400,300 | $474,000 | $926,300 |
| 2022 | $21,144 | $1,171,400 | $434,800 | $736,600 |
| 2021 | $20,532 | $1,090,400 | $434,800 | $655,600 |
| 2020 | $20,118 | $1,090,400 | $434,800 | $655,600 |
| 2019 | $19,529 | $1,090,400 | $434,800 | $655,600 |
| 2018 | $19,034 | $1,061,600 | $462,400 | $599,200 |
| 2017 | $18,654 | $1,051,500 | $458,000 | $593,500 |
| 2016 | $16,323 | $917,000 | $353,600 | $563,400 |
| 2015 | $15,706 | $892,400 | $340,000 | $552,400 |
| 2014 | $5,950 | $330,000 | $330,000 | $0 |
Source: Public Records
Map
Nearby Homes
- 270 Old Lancaster Rd
- 94 Goodmans Hill Rd
- 36 Concord Rd
- 427 Concord Rd
- 23 Massasoit Ave
- 89 Bridle Path
- 1011 Boston Post Rd
- 24 Goodnow Rd
- 6 Old County Rd Unit 16
- 216 Landham Rd
- 36 Old Forge Ln
- 24 Woodland Rd
- 63 Canterbury Dr
- 7 Saddle Ridge Rd
- 30 Rolling Ln
- 7 Adams Rd
- 0 Robbins Rd
- 12 Hickory Rd
- 128 Nobscot Rd
- 54 Stone Rd
- 3 Olde Bostonian Way
- 2 Bostonian Way Unit Lot 2
- 2 Bostonian Way
- 2 Bostonian Way
- 261 Goodmans Hill Rd
- 6 Bostonian Way
- 273 Goodmans Hill Rd
- 5 Bostonian Way Unit Lot 1
- 280 Goodmans Hill Rd
- 253 Goodmans Hill Rd
- 281 Goodmans Hill Rd
- 31 Plantation Cir
- 249 Goodmans Hill Rd
- 286 Goodmans Hill Rd
- 256 Goodman's Hill Rd
- 256 Goodmans Hill Rd
- 245 Goodmans Hill Rd
- 258 Goodmans Hill Rd
- 250 Goodmans Hill Rd
- 11 Antique Cir