267 Gray St Defiance, OH 43512
Estimated Value: $76,000 - $152,000
4
Beds
2
Baths
1,252
Sq Ft
$100/Sq Ft
Est. Value
About This Home
This home is located at 267 Gray St, Defiance, OH 43512 and is currently estimated at $125,731, approximately $100 per square foot. 267 Gray St is a home located in Defiance County with nearby schools including Defiance Elementary School, Defiance Middle School, and Defiance High School.
Ownership History
Date
Name
Owned For
Owner Type
Purchase Details
Closed on
Oct 19, 2018
Sold by
Westrick George J and Westrick Rita E
Bought by
Dunlap Tyler and Fooce Amanda
Current Estimated Value
Home Financials for this Owner
Home Financials are based on the most recent Mortgage that was taken out on this home.
Original Mortgage
$75,050
Outstanding Balance
$65,448
Interest Rate
4.5%
Mortgage Type
New Conventional
Estimated Equity
$60,283
Purchase Details
Closed on
Jan 1, 1992
Bought by
Westrick George J and Westrick Rita E
Create a Home Valuation Report for This Property
The Home Valuation Report is an in-depth analysis detailing your home's value as well as a comparison with similar homes in the area
Home Values in the Area
Average Home Value in this Area
Purchase History
| Date | Buyer | Sale Price | Title Company |
|---|---|---|---|
| Dunlap Tyler | $79,000 | Merestone Title Agency | |
| Westrick George J | -- | -- |
Source: Public Records
Mortgage History
| Date | Status | Borrower | Loan Amount |
|---|---|---|---|
| Open | Dunlap Tyler | $75,050 |
Source: Public Records
Tax History Compared to Growth
Tax History
| Year | Tax Paid | Tax Assessment Tax Assessment Total Assessment is a certain percentage of the fair market value that is determined by local assessors to be the total taxable value of land and additions on the property. | Land | Improvement |
|---|---|---|---|---|
| 2024 | $1,360 | $36,230 | $3,210 | $33,020 |
| 2023 | $1,360 | $36,230 | $3,210 | $33,020 |
| 2022 | $1,159 | $27,560 | $3,210 | $24,350 |
| 2021 | $1,159 | $27,560 | $3,210 | $24,350 |
| 2020 | $1,168 | $27,560 | $3,210 | $24,350 |
| 2019 | $1,109 | $25,600 | $3,200 | $22,400 |
| 2018 | $1,106 | $25,600 | $3,200 | $22,400 |
| 2017 | $1,091 | $25,606 | $3,202 | $22,404 |
| 2016 | $1,053 | $23,954 | $3,150 | $20,804 |
| 2015 | $509 | $23,989 | $3,150 | $20,839 |
| 2014 | $509 | $23,989 | $3,150 | $20,839 |
| 2013 | $509 | $23,989 | $3,150 | $20,839 |
| 2012 | $509 | $23,989 | $3,150 | $20,839 |
Source: Public Records
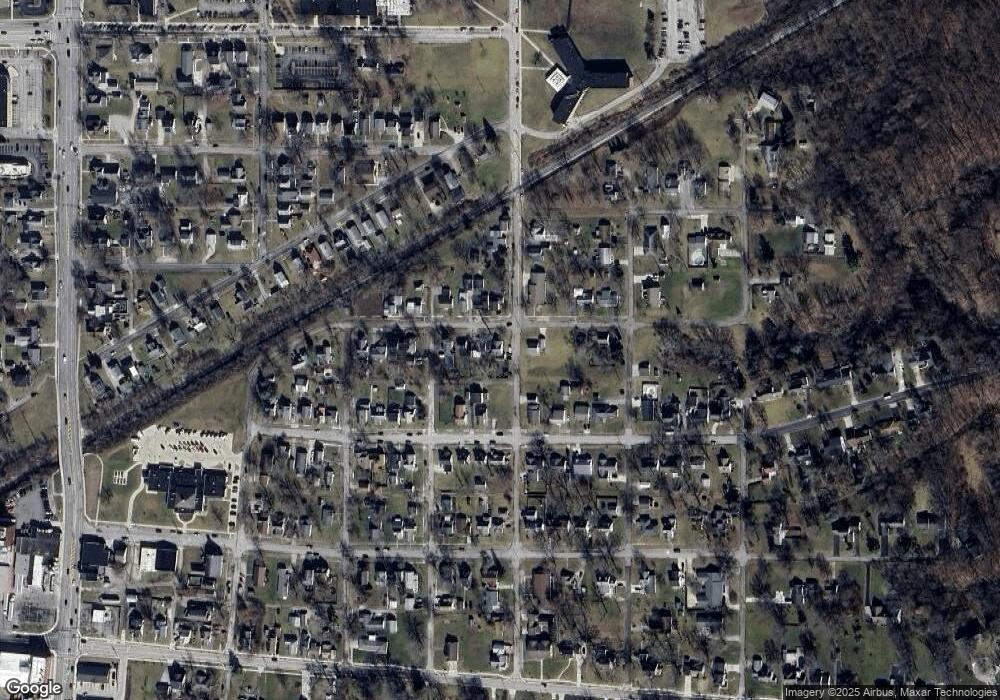
Map
Nearby Homes