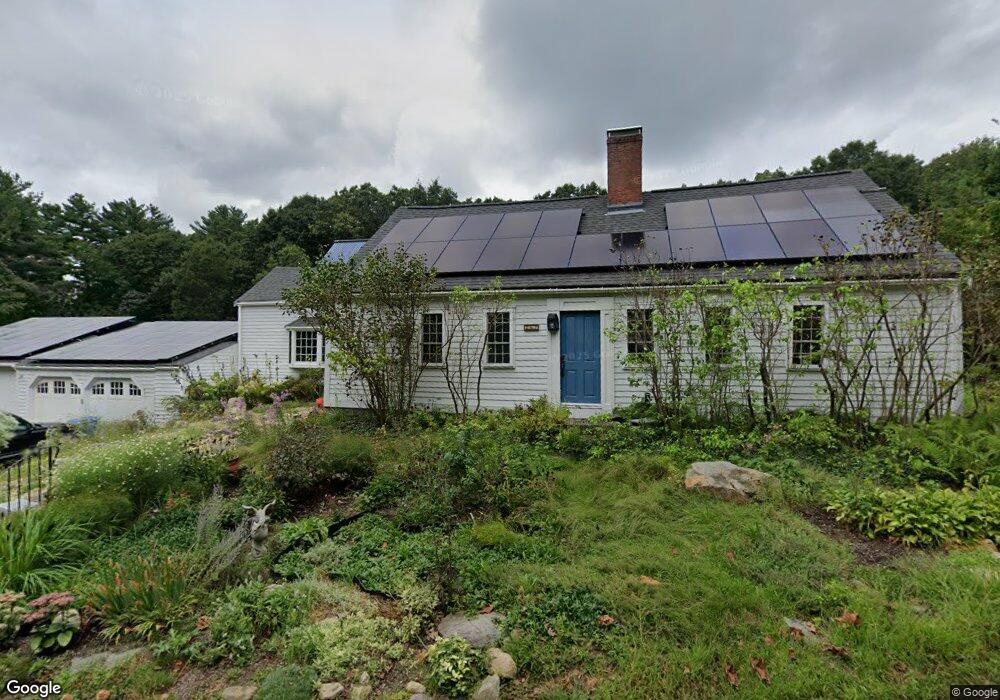
267 Hancock St Wrentham, MA 02093
Sheldonville NeighborhoodEstimated Value: $640,000 - $788,000
3
Beds
3
Baths
2,553
Sq Ft
$286/Sq Ft
Est. Value
About This Home
This home is located at 267 Hancock St, Wrentham, MA 02093 and is currently estimated at $729,064, approximately $285 per square foot. 267 Hancock St is a home located in Norfolk County with nearby schools including Delaney Elementary School, Charles E Roderick, and Mercymount Country Day School.
Ownership History
Date
Name
Owned For
Owner Type
Purchase Details
Closed on
Sep 1, 1999
Sold by
Schoeler Janet C
Bought by
Lagasse Jeremy R and Lagasse Laurie A
Current Estimated Value
Create a Home Valuation Report for This Property
The Home Valuation Report is an in-depth analysis detailing your home's value as well as a comparison with similar homes in the area
Home Values in the Area
Average Home Value in this Area
Purchase History
| Date | Buyer | Sale Price | Title Company |
|---|---|---|---|
| Lagasse Jeremy R | $265,000 | -- |
Source: Public Records
Mortgage History
| Date | Status | Borrower | Loan Amount |
|---|---|---|---|
| Open | Lagasse Jeremy R | $192,000 | |
| Closed | Lagasse Jeremy R | $40,000 | |
| Closed | Lagasse Jeremy R | $212,000 |
Source: Public Records
Tax History Compared to Growth
Tax History
| Year | Tax Paid | Tax Assessment Tax Assessment Total Assessment is a certain percentage of the fair market value that is determined by local assessors to be the total taxable value of land and additions on the property. | Land | Improvement |
|---|---|---|---|---|
| 2025 | $7,273 | $627,500 | $331,900 | $295,600 |
| 2024 | $7,408 | $617,300 | $331,900 | $285,400 |
| 2023 | $6,493 | $514,500 | $301,900 | $212,600 |
| 2022 | $6,980 | $510,600 | $282,000 | $228,600 |
| 2021 | $6,541 | $464,900 | $246,200 | $218,700 |
| 2020 | $6,424 | $450,800 | $219,200 | $231,600 |
| 2019 | $6,365 | $450,800 | $219,200 | $231,600 |
| 2018 | $6,515 | $457,500 | $197,000 | $260,500 |
| 2017 | $6,133 | $430,400 | $193,200 | $237,200 |
| 2016 | $6,045 | $423,300 | $187,700 | $235,600 |
| 2015 | $5,841 | $389,900 | $180,400 | $209,500 |
| 2014 | $5,750 | $375,600 | $173,500 | $202,100 |
Source: Public Records
Map
Nearby Homes
- 277 Hancock St
- 298 Hancock St
- 170 Cherry St
- 316 Hancock St
- 316 Hancock St Unit 1
- 316 Hancock St Unit 316
- 160 Cherry St
- 150 Cherry St
- 175 Cherry St
- 326 Hancock St
- 140 Cherry St
- Lot 2 Cherry St
- 366 Hancock St
- 165 Cherry St
- 165 Cherry St Unit 1
- 130 Cherry St
- 151 Cherry St
- 376 Hancock St
- 233 Hancock St
- 155 Cherry St