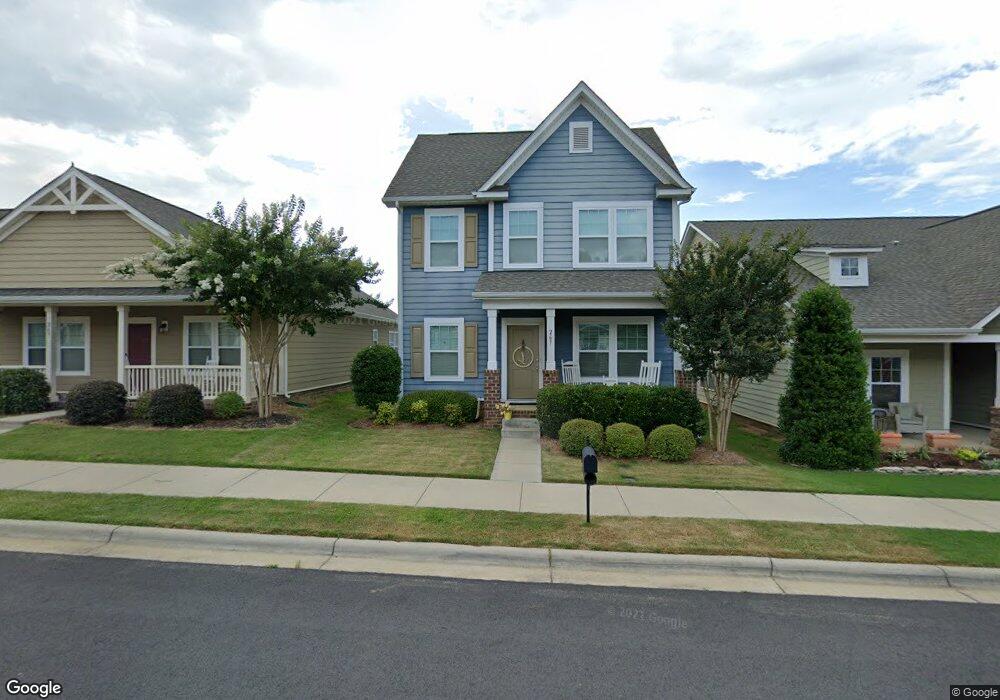
267 Harrison Ln Unit 29 Locust, NC 28097
Estimated Value: $302,000 - $335,954
3
Beds
3
Baths
1,734
Sq Ft
$183/Sq Ft
Est. Value
About This Home
This home is located at 267 Harrison Ln Unit 29, Locust, NC 28097 and is currently estimated at $316,989, approximately $182 per square foot. 267 Harrison Ln Unit 29 is a home located in Stanly County with nearby schools including Locust Elementary School, West Stanly Middle School, and West Stanly High School.
Ownership History
Date
Name
Owned For
Owner Type
Purchase Details
Closed on
Nov 19, 2025
Sold by
Lowder Krystal H and Walden Jared R
Bought by
Idf1 Sfr Propco A Llc
Current Estimated Value
Purchase Details
Closed on
Nov 14, 2022
Sold by
Hudson Tommy C
Bought by
Lowder Krystal H
Home Financials for this Owner
Home Financials are based on the most recent Mortgage that was taken out on this home.
Original Mortgage
$201,588
Interest Rate
4.75%
Mortgage Type
New Conventional
Purchase Details
Closed on
May 13, 2021
Sold by
Kiser Jaren Scott
Bought by
Lowder Krystal H and Lowder Tommy C
Home Financials for this Owner
Home Financials are based on the most recent Mortgage that was taken out on this home.
Original Mortgage
$198,000
Interest Rate
2.75%
Mortgage Type
New Conventional
Purchase Details
Closed on
Dec 16, 2016
Sold by
True Homes Llc
Bought by
Kiser Jaren Scott
Create a Home Valuation Report for This Property
The Home Valuation Report is an in-depth analysis detailing your home's value as well as a comparison with similar homes in the area
Home Values in the Area
Average Home Value in this Area
Purchase History
| Date | Buyer | Sale Price | Title Company |
|---|---|---|---|
| Idf1 Sfr Propco A Llc | $306,500 | None Listed On Document | |
| Idf1 Sfr Propco A Llc | $306,500 | None Listed On Document | |
| Lowder Krystal H | -- | -- | |
| Lowder Krystal H | -- | -- | |
| Lowder Krystal H | $255,000 | None Available | |
| Lowder Krystal H | $255,000 | None Available | |
| Kiser Jaren Scott | $169,000 | Attorney | |
| Kiser Jaren Scott | $169,000 | Attorney |
Source: Public Records
Mortgage History
| Date | Status | Borrower | Loan Amount |
|---|---|---|---|
| Previous Owner | Lowder Krystal H | $201,588 | |
| Previous Owner | Lowder Krystal H | $198,000 |
Source: Public Records
Tax History
| Year | Tax Paid | Tax Assessment Tax Assessment Total Assessment is a certain percentage of the fair market value that is determined by local assessors to be the total taxable value of land and additions on the property. | Land | Improvement |
|---|---|---|---|---|
| 2025 | $2,930 | $318,526 | $65,000 | $253,526 |
| 2024 | $2,439 | $223,777 | $30,000 | $193,777 |
| 2023 | $2,559 | $223,777 | $30,000 | $193,777 |
| 2022 | $2,537 | $223,777 | $30,000 | $193,777 |
| 2021 | $2,514 | $223,777 | $30,000 | $193,777 |
| 2020 | $2,018 | $169,794 | $30,000 | $139,794 |
| 2019 | $2,039 | $169,794 | $30,000 | $139,794 |
| 2018 | $1,919 | $169,794 | $30,000 | $139,794 |
| 2017 | $1,919 | $169,794 | $30,000 | $139,794 |
| 2016 | $1,900 | $168,175 | $30,000 | $138,175 |
Source: Public Records
Map
Nearby Homes
- 288 Harrison Ln
- 617 Ardsley Dr
- 417 Kiser Ln
- 219 Kerri Dawn Ln
- 207 Kerri Dawn Ln
- 117 Battery Dr
- 166 Battery Dr
- 306 Old Hickory Rd
- 319 N Central Ave
- 117 Danita Dr
- 230 Battery Dr
- 211 Amber Glen Dr
- 205 Amber Glen Dr
- 217 Amber Glen Dr
- 201 Amber Glen Dr
- 221 Amber Glen Dr
- 225 Amber Glen Dr
- 229 Amber Glen Dr
- 233 Amber Glen Dr
- 237 Amber Glen Dr
- 267 Harrison Ln
- 271 Harrison Ln
- 263 Harrison Ln
- 261 Harrison Ln Unit 31
- 261 Harrison Ln
- 277 Harrison Ln Unit Lot 68
- 277 Harrison Ln
- 257 Harrison Ln
- 000 Ray Kennedy Dr Unit 54-96
- 268 Harrison Ln
- 140 Kingston Dr
- 132 Kingston Dr
- 144 Kingston Dr
- 281 Harrison Ln
- Lot 27 Harrison Ln
- 272 Harrison Ln
- 264 Harrison Ln
- 262 Harrison Ln
- 262 Harrison Ln Unit 24
- 128 Kingston Dr
Your Personal Tour Guide
Ask me questions while you tour the home.