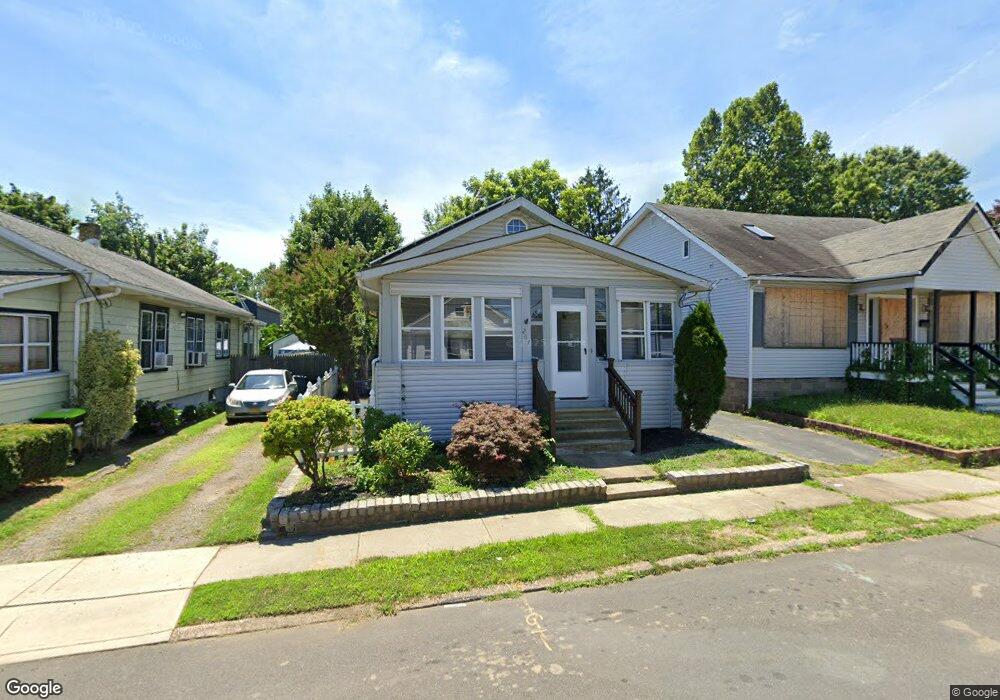
267 Homecrest Ave Ewing, NJ 08638
Prospect NeighborhoodEstimated Value: $220,704 - $281,000
2
Beds
1
Bath
890
Sq Ft
$281/Sq Ft
Est. Value
About This Home
This home is located at 267 Homecrest Ave, Ewing, NJ 08638 and is currently estimated at $250,426, approximately $281 per square foot. 267 Homecrest Ave is a home located in Mercer County with nearby schools including Ewing High School and Trenton Stem-To-Civics Charter School.
Ownership History
Date
Name
Owned For
Owner Type
Purchase Details
Closed on
Oct 28, 2024
Sold by
Pmc Sfr Holding Llc
Bought by
Rcf Ii Sfr Gsb Holding Llc
Current Estimated Value
Purchase Details
Closed on
Dec 28, 2020
Sold by
Pmc Sfr Borrower 2 Llc
Bought by
Pmc Sfr Holding Llc
Purchase Details
Closed on
Dec 18, 2017
Sold by
Whetstone Geroge
Bought by
Williamgton Savings Fund Society Fsb and Christiana Trust
Purchase Details
Closed on
Jul 19, 1999
Sold by
Zombeck James
Bought by
Whetstone George and Whetstone Sandy
Home Financials for this Owner
Home Financials are based on the most recent Mortgage that was taken out on this home.
Original Mortgage
$81,853
Interest Rate
7.49%
Mortgage Type
FHA
Purchase Details
Closed on
Sep 27, 1991
Sold by
Ivan Lillian D
Bought by
Zombeck James F
Create a Home Valuation Report for This Property
The Home Valuation Report is an in-depth analysis detailing your home's value as well as a comparison with similar homes in the area
Home Values in the Area
Average Home Value in this Area
Purchase History
| Date | Buyer | Sale Price | Title Company |
|---|---|---|---|
| Rcf Ii Sfr Gsb Holding Llc | -- | None Listed On Document | |
| Pmc Sfr Holding Llc | -- | Selectitle Llc | |
| Williamgton Savings Fund Society Fsb | -- | None Available | |
| Whetstone George | $82,000 | -- | |
| Zombeck James F | $74,000 | -- |
Source: Public Records
Mortgage History
| Date | Status | Borrower | Loan Amount |
|---|---|---|---|
| Previous Owner | Whetstone George | $81,853 |
Source: Public Records
Tax History Compared to Growth
Tax History
| Year | Tax Paid | Tax Assessment Tax Assessment Total Assessment is a certain percentage of the fair market value that is determined by local assessors to be the total taxable value of land and additions on the property. | Land | Improvement |
|---|---|---|---|---|
| 2025 | $4,232 | $107,600 | $40,000 | $67,600 |
| 2024 | $3,978 | $107,600 | $40,000 | $67,600 |
| 2023 | $3,978 | $107,600 | $40,000 | $67,600 |
| 2022 | $3,870 | $107,600 | $40,000 | $67,600 |
| 2021 | $3,776 | $107,600 | $40,000 | $67,600 |
| 2020 | $3,722 | $107,600 | $40,000 | $67,600 |
| 2019 | $3,625 | $107,600 | $40,000 | $67,600 |
| 2018 | $3,814 | $72,200 | $27,000 | $45,200 |
| 2017 | $3,902 | $72,200 | $27,000 | $45,200 |
| 2016 | $3,850 | $72,200 | $27,000 | $45,200 |
| 2015 | $3,798 | $72,200 | $27,000 | $45,200 |
| 2014 | $3,788 | $72,200 | $27,000 | $45,200 |
Source: Public Records
Map
Nearby Homes
- 2 Mccarthy Dr
- 6 New Hillcrest Ave
- 37 Hazelhurst Ave
- 7 Pershing Ave
- 252 Parkway Ave
- 166 Clover Ave
- 1011 Parkside Ave
- 131 Homecrest Ave
- 107 Brinton Ave
- 46 Rosedale Ave
- 108 Homecrest Ave
- 803 Pennington Ave
- 116 Oliver Ave
- 16 Clover Ave
- 1236 Prospect St
- 110 Parkway Ave
- 318 Gardner Ave
- 330 Hillcrest Ave
- 310 Pingree Ave
- 644 Concord Cir
- 265 Homecrest Ave
- 263 Homecrest Ave
- 269 Homecrest Ave
- 278 Greenland Ave
- 280 Greenland Ave
- 276 Greenland Ave
- 261 Homecrest Ave
- 282 Greenland Ave
- 274 Greenland Ave
- 275 Homecrest Ave
- 272 Greenland Ave
- 284 Greenland Ave
- 252 Homecrest Ave Crestmont Dr
- 270 Greenland Ave
- 259 Homecrest Ave
- 286 Greenland Ave
- 258 Homecrest Ave
- 264 Homecrest Ave
- 254 Homecrest Ave
- 268 Greenland Ave