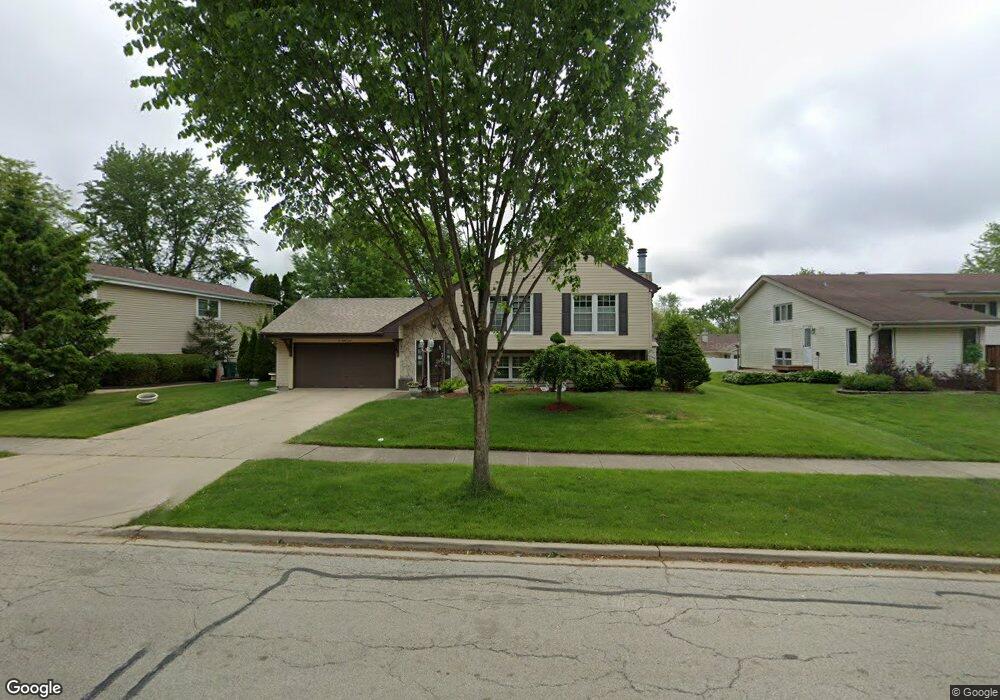
267 Langton Ln Bloomingdale, IL 60108
Estimated Value: $430,014 - $503,000
4
Beds
3
Baths
2,371
Sq Ft
$194/Sq Ft
Est. Value
About This Home
This home is located at 267 Langton Ln, Bloomingdale, IL 60108 and is currently estimated at $461,004, approximately $194 per square foot. 267 Langton Ln is a home located in DuPage County with nearby schools including Dujardin Elementary School, Westfield Middle School, and Lake Park High School.
Ownership History
Date
Name
Owned For
Owner Type
Purchase Details
Closed on
Jun 1, 2001
Sold by
Belu Milka and Zekic Lidija
Bought by
Gonzales Nestor R and Gonzales Yvonne
Current Estimated Value
Home Financials for this Owner
Home Financials are based on the most recent Mortgage that was taken out on this home.
Original Mortgage
$150,000
Outstanding Balance
$57,013
Interest Rate
7.11%
Estimated Equity
$403,991
Purchase Details
Closed on
May 30, 2001
Sold by
Zekic Dejan and Case #97 D 2323
Bought by
Zekic Lidija
Home Financials for this Owner
Home Financials are based on the most recent Mortgage that was taken out on this home.
Original Mortgage
$150,000
Outstanding Balance
$57,013
Interest Rate
7.11%
Estimated Equity
$403,991
Purchase Details
Closed on
Feb 2, 1994
Sold by
Belu Trifu and Belu Milka
Bought by
Belu Milka
Create a Home Valuation Report for This Property
The Home Valuation Report is an in-depth analysis detailing your home's value as well as a comparison with similar homes in the area
Home Values in the Area
Average Home Value in this Area
Purchase History
| Date | Buyer | Sale Price | Title Company |
|---|---|---|---|
| Gonzales Nestor R | $222,500 | First American Title Ins | |
| Zekic Lidija | -- | First American Title Ins | |
| Belu Milka | -- | -- |
Source: Public Records
Mortgage History
| Date | Status | Borrower | Loan Amount |
|---|---|---|---|
| Open | Gonzales Nestor R | $150,000 |
Source: Public Records
Tax History Compared to Growth
Tax History
| Year | Tax Paid | Tax Assessment Tax Assessment Total Assessment is a certain percentage of the fair market value that is determined by local assessors to be the total taxable value of land and additions on the property. | Land | Improvement |
|---|---|---|---|---|
| 2024 | $8,934 | $128,672 | $34,806 | $93,866 |
| 2023 | $8,250 | $117,670 | $31,830 | $85,840 |
| 2022 | $7,667 | $110,620 | $31,620 | $79,000 |
| 2021 | $7,372 | $105,100 | $30,040 | $75,060 |
| 2020 | $7,442 | $102,540 | $29,310 | $73,230 |
| 2019 | $7,187 | $98,540 | $28,170 | $70,370 |
| 2018 | $7,730 | $106,880 | $27,430 | $79,450 |
| 2017 | $7,311 | $99,060 | $25,420 | $73,640 |
| 2016 | $7,032 | $91,680 | $23,530 | $68,150 |
| 2015 | $6,919 | $85,560 | $21,960 | $63,600 |
| 2014 | $7,029 | $84,540 | $21,700 | $62,840 |
| 2013 | $6,950 | $87,430 | $22,440 | $64,990 |
Source: Public Records
Map
Nearby Homes
- 161 N Waters Edge Dr Unit 202
- 201 N Waters Edge Dr Unit 101
- 253 Sterling Ln
- 2257 Lake Ridge Dr Unit 74
- 169 E Lake Ridge Dr Unit 21
- 135 Fairlane Ct Unit B
- 2158 College Dr Unit 7
- 2155 College Dr Unit 7
- 224 Oakwood Ln
- 187 W Army Trail Rd
- 279 Blue Spruce Ln
- 158 S Prairie Ave
- 258 Thrasher St
- 133 Harding Ct
- 148 Longridge Dr
- 177 Cardinal Dr
- 2018 Stonefield Dr
- 89 Stonefield Dr
- 67 Stonefield Dr
- 1943 Towner Ln
- 269 Langton Ln
- 265 Langton Ln
- 268 Winston Ln
- 270 Winston Ln Unit 6
- 263 Langton Ln
- 271 Langton Ln
- 270 Langton Ln
- 272 Langton Ln
- 268 Langton Ln
- 266 Winston Ln
- 272 Winston Ln
- 266 Langton Ln
- 274 Winston Ln
- 273 Langton Ln
- 261 Langton Ln
- 264 Langton Ln
- 273 Oxford Ln
- 271 Oxford Ln
- 269 Oxford Ln
- 110 Langton Dr