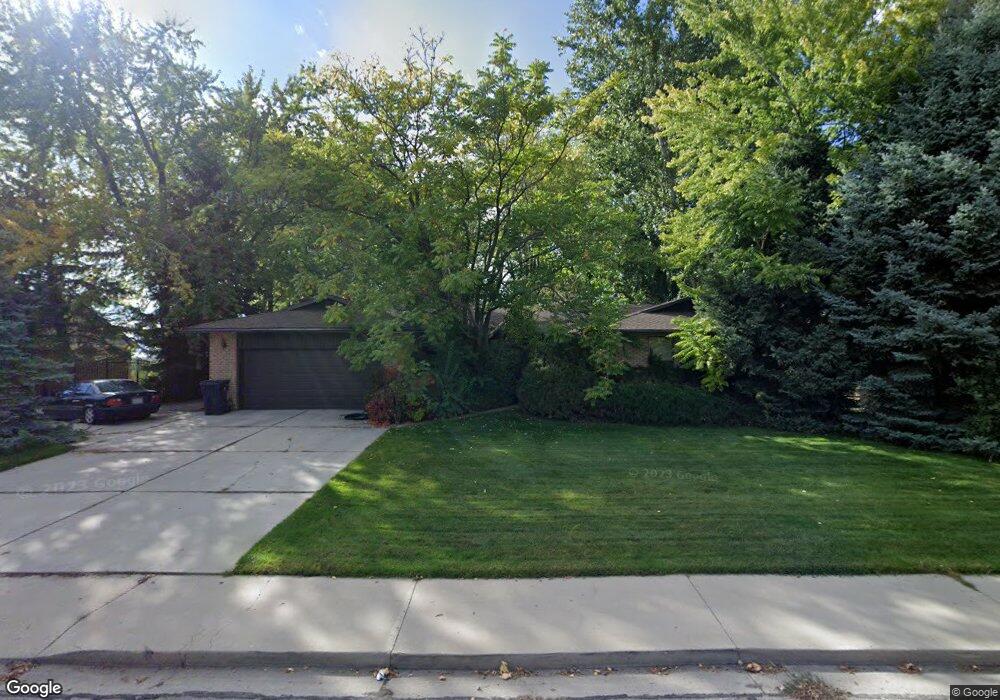
267 N 835 E Lindon, UT 84042
Estimated Value: $638,944 - $816,000
3
Beds
3
Baths
1,846
Sq Ft
$394/Sq Ft
Est. Value
About This Home
This home is located at 267 N 835 E, Lindon, UT 84042 and is currently estimated at $726,486, approximately $393 per square foot. 267 N 835 E is a home located in Utah County with nearby schools including Rocky Mountain Elementary, Oak Canyon Junior High School, and Pleasant Grove High School.
Ownership History
Date
Name
Owned For
Owner Type
Purchase Details
Closed on
Feb 6, 2012
Sold by
Healey Scott M
Bought by
Healey Scott Melvin and Scott M Healey Trust
Current Estimated Value
Purchase Details
Closed on
Jun 9, 2010
Sold by
Healey Scott M and Healey Tamara L
Bought by
Healey Scott M
Home Financials for this Owner
Home Financials are based on the most recent Mortgage that was taken out on this home.
Original Mortgage
$190,000
Outstanding Balance
$125,513
Interest Rate
4.68%
Mortgage Type
Credit Line Revolving
Estimated Equity
$600,973
Purchase Details
Closed on
Aug 5, 1997
Sold by
Howarth Joseph L and Howarth Marion H
Bought by
Healey Investments L C
Home Financials for this Owner
Home Financials are based on the most recent Mortgage that was taken out on this home.
Original Mortgage
$110,000
Interest Rate
7.57%
Create a Home Valuation Report for This Property
The Home Valuation Report is an in-depth analysis detailing your home's value as well as a comparison with similar homes in the area
Home Values in the Area
Average Home Value in this Area
Purchase History
| Date | Buyer | Sale Price | Title Company |
|---|---|---|---|
| Healey Scott Melvin | -- | None Available | |
| Healey Scott M | -- | Title West Orem | |
| Healey Scott M | -- | Title West Orem | |
| Healey Investments L C | -- | -- |
Source: Public Records
Mortgage History
| Date | Status | Borrower | Loan Amount |
|---|---|---|---|
| Open | Healey Scott M | $190,000 | |
| Closed | Healey Scott M | $190,000 | |
| Closed | Healey Investments L C | $110,000 |
Source: Public Records
Tax History
| Year | Tax Paid | Tax Assessment Tax Assessment Total Assessment is a certain percentage of the fair market value that is determined by local assessors to be the total taxable value of land and additions on the property. | Land | Improvement |
|---|---|---|---|---|
| 2025 | $2,590 | $330,110 | -- | -- |
| 2024 | $2,590 | $319,275 | $0 | $0 |
| 2023 | $2,463 | $326,095 | $0 | $0 |
| 2022 | $2,529 | $323,510 | $0 | $0 |
| 2021 | $2,276 | $439,000 | $157,500 | $281,500 |
| 2020 | $2,115 | $401,500 | $143,200 | $258,300 |
| 2019 | $1,857 | $367,800 | $143,200 | $224,600 |
| 2018 | $1,813 | $338,500 | $143,200 | $195,300 |
| 2017 | $1,657 | $165,935 | $0 | $0 |
| 2016 | $1,477 | $136,840 | $0 | $0 |
| 2015 | $1,536 | $134,530 | $0 | $0 |
| 2014 | $1,401 | $121,550 | $0 | $0 |
Source: Public Records
Map
Nearby Homes
Your Personal Tour Guide
Ask me questions while you tour the home.