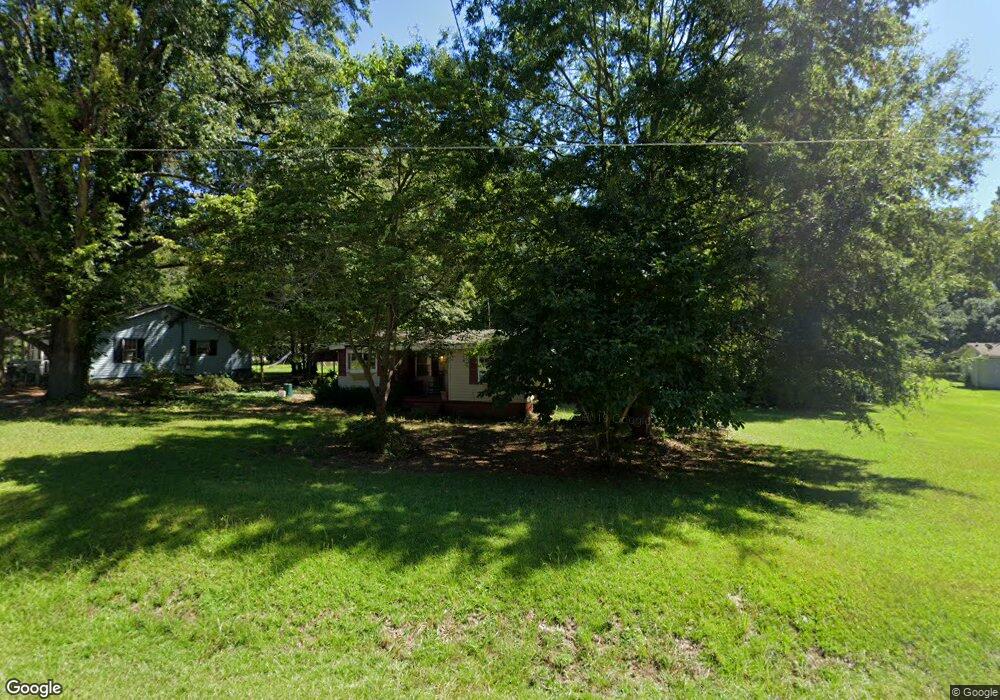
267 Poplar Cir Lagrange, GA 30241
Estimated Value: $165,000 - $189,000
3
Beds
1
Bath
1,193
Sq Ft
$146/Sq Ft
Est. Value
About This Home
This home is located at 267 Poplar Cir, Lagrange, GA 30241 and is currently estimated at $174,293, approximately $146 per square foot. 267 Poplar Cir is a home located in Troup County with nearby schools including Callaway Elementary School, Hogansville Elementary School, and Callaway Middle School.
Ownership History
Date
Name
Owned For
Owner Type
Purchase Details
Closed on
Jan 15, 2021
Sold by
Tnt Homes Llc
Bought by
Rogers Joseph G and Rogers Chelsie L
Current Estimated Value
Home Financials for this Owner
Home Financials are based on the most recent Mortgage that was taken out on this home.
Original Mortgage
$106,043
Outstanding Balance
$94,577
Interest Rate
2.67%
Mortgage Type
FHA
Estimated Equity
$79,716
Purchase Details
Closed on
Sep 25, 2020
Sold by
Epps Alfreda Mae
Bought by
Tnt Homes Llc
Purchase Details
Closed on
Jan 30, 1995
Sold by
Wilburn Costley
Bought by
Epps Alfreda Mae
Purchase Details
Closed on
Feb 20, 1978
Bought by
Wilburn Costley
Purchase Details
Closed on
Oct 16, 1974
Sold by
Costley Wilburn
Purchase Details
Closed on
May 8, 1962
Bought by
Costley Wilburn
Create a Home Valuation Report for This Property
The Home Valuation Report is an in-depth analysis detailing your home's value as well as a comparison with similar homes in the area
Home Values in the Area
Average Home Value in this Area
Purchase History
| Date | Buyer | Sale Price | Title Company |
|---|---|---|---|
| Rogers Joseph G | $108,000 | -- | |
| Tnt Homes Llc | $16,000 | -- | |
| Epps Alfreda Mae | $46,500 | -- | |
| Wilburn Costley | $4,000 | -- | |
| -- | -- | -- | |
| Costley Wilburn | -- | -- |
Source: Public Records
Mortgage History
| Date | Status | Borrower | Loan Amount |
|---|---|---|---|
| Open | Rogers Joseph G | $106,043 |
Source: Public Records
Tax History Compared to Growth
Tax History
| Year | Tax Paid | Tax Assessment Tax Assessment Total Assessment is a certain percentage of the fair market value that is determined by local assessors to be the total taxable value of land and additions on the property. | Land | Improvement |
|---|---|---|---|---|
| 2024 | $1,323 | $48,524 | $10,000 | $38,524 |
| 2023 | $1,323 | $48,512 | $10,000 | $38,512 |
| 2022 | $1,153 | $41,312 | $8,000 | $33,312 |
| 2021 | $1,064 | $35,268 | $4,000 | $31,268 |
| 2020 | $580 | $21,228 | $4,000 | $17,228 |
| 2019 | $581 | $21,256 | $4,000 | $17,256 |
| 2018 | $500 | $18,568 | $1,312 | $17,256 |
| 2017 | $500 | $18,568 | $1,312 | $17,256 |
| 2016 | $484 | $18,026 | $1,312 | $16,714 |
| 2015 | $485 | $18,026 | $1,312 | $16,714 |
| 2014 | $459 | $17,146 | $1,312 | $15,834 |
| 2013 | -- | $17,128 | $1,312 | $15,816 |
Source: Public Records
Map
Nearby Homes
- 215 Poplar Cir
- 311 Mourning Ct Unit LOT 33
- 313 Mourning Ct Unit LOT 32
- 75 Thomas Rd
- 0 Upper Big Springs Rd Unit 10545622
- 113 Pine Cir
- 1017 Mason St
- 957 Kelley St
- 0 Corporate Park Ct E Unit 10608830
- 0 Corporate Park Ct E Unit 10608762
- 913 Arizona St Unit A AND B
- 0 Kelley St Unit 10550311
- 1604 S Davis Rd
- LOT 4 Borton St
- LOT 3 Borton St
- LOT 5 Borton St
- LOT 6 Borton St
- 319 Cooley Rd
- 0 E Render St
- 206 Clearview Ct
- 265 Poplar Cir
- 281 Poplar Cir
- 263 Poplar Cir
- 285 Poplar Cir
- 247 Poplar Cir
- 290 Poplar Cir
- 178 Mallory Dr
- 266 Poplar Cir
- 176 Mallory Dr
- 180 Mallory Dr
- 174 Mallory Dr
- 174 Mallory Dr
- 297 Poplar Cir
- 244 Poplar Cir
- 172 Mallory Dr
- 245 Poplar Cir
- 299 Poplar Cir
- 181 Mallory Dr
- 170 Mallory Dr
- 173 1/2 Mallory Dr