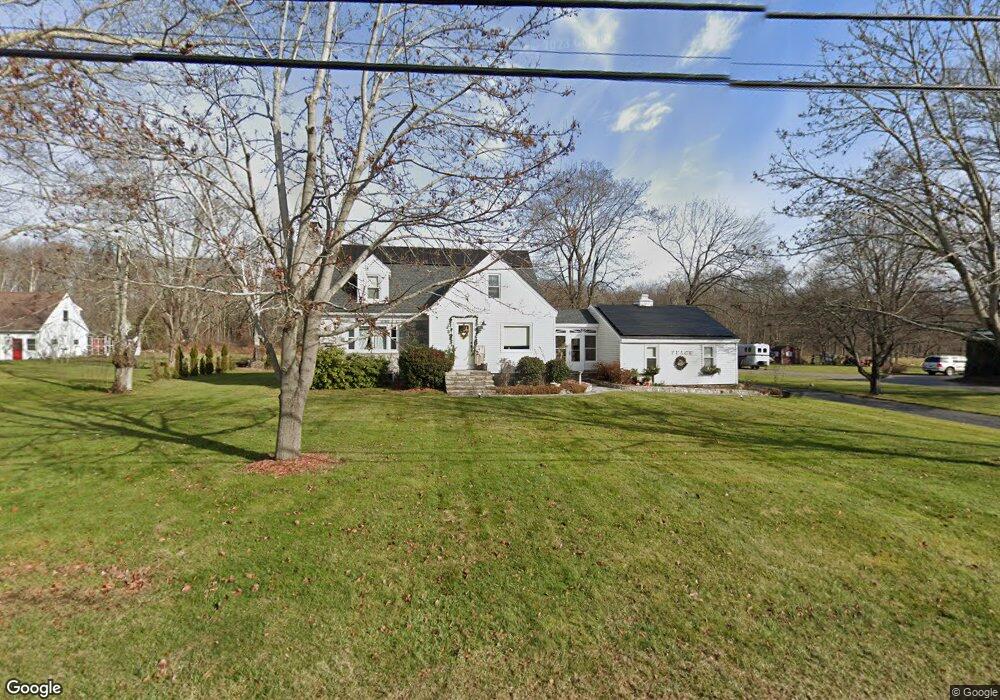
267 Route 87 Columbia, CT 06237
Estimated Value: $405,225 - $577,000
2
Beds
2
Baths
2,126
Sq Ft
$221/Sq Ft
Est. Value
About This Home
This home is located at 267 Route 87, Columbia, CT 06237 and is currently estimated at $470,056, approximately $221 per square foot. 267 Route 87 is a home located in Tolland County with nearby schools including Horace W. Porter School.
Ownership History
Date
Name
Owned For
Owner Type
Purchase Details
Closed on
May 14, 2003
Sold by
Kurcinik Shirley Est
Bought by
Deforest Marcus and Deforest Kelly
Current Estimated Value
Home Financials for this Owner
Home Financials are based on the most recent Mortgage that was taken out on this home.
Original Mortgage
$218,250
Interest Rate
5.84%
Mortgage Type
Purchase Money Mortgage
Create a Home Valuation Report for This Property
The Home Valuation Report is an in-depth analysis detailing your home's value as well as a comparison with similar homes in the area
Home Values in the Area
Average Home Value in this Area
Purchase History
| Date | Buyer | Sale Price | Title Company |
|---|---|---|---|
| Deforest Marcus | $225,000 | -- |
Source: Public Records
Mortgage History
| Date | Status | Borrower | Loan Amount |
|---|---|---|---|
| Closed | Deforest Marcus | $55,000 | |
| Open | Deforest Marcus | $160,500 | |
| Closed | Deforest Marcus | $190,294 | |
| Closed | Deforest Marcus | $218,250 |
Source: Public Records
Tax History Compared to Growth
Tax History
| Year | Tax Paid | Tax Assessment Tax Assessment Total Assessment is a certain percentage of the fair market value that is determined by local assessors to be the total taxable value of land and additions on the property. | Land | Improvement |
|---|---|---|---|---|
| 2025 | $5,151 | $175,980 | $38,920 | $137,060 |
| 2024 | $4,949 | $175,980 | $38,920 | $137,060 |
| 2023 | $4,560 | $175,980 | $38,920 | $137,060 |
| 2022 | $4,553 | $175,980 | $38,920 | $137,060 |
| 2021 | $4,288 | $146,200 | $35,200 | $111,000 |
| 2020 | $4,288 | $146,200 | $35,200 | $111,000 |
| 2019 | $4,115 | $140,300 | $35,200 | $105,100 |
| 2018 | $4,115 | $140,300 | $35,200 | $105,100 |
| 2017 | $4,052 | $140,300 | $35,200 | $105,100 |
| 2016 | $3,778 | $137,700 | $35,200 | $102,500 |
| 2015 | $3,736 | $137,700 | $35,200 | $102,500 |
| 2014 | $3,736 | $137,700 | $35,200 | $102,500 |
Source: Public Records
Map
Nearby Homes