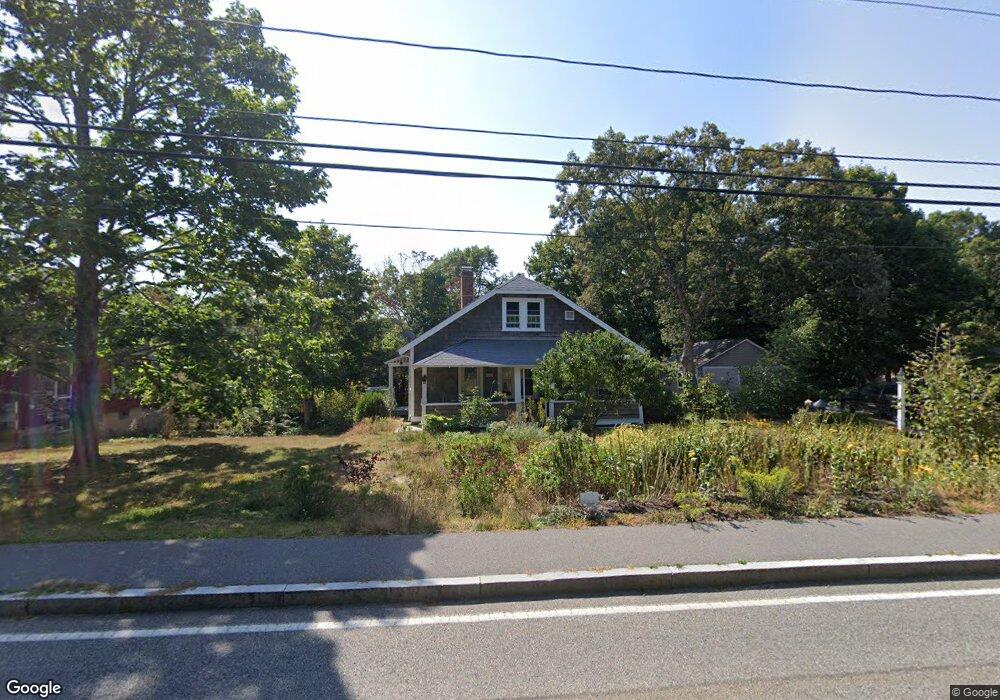
267 School St Cotuit, MA 02635
Cotuit NeighborhoodEstimated Value: $610,280 - $685,000
4
Beds
1
Bath
1,501
Sq Ft
$429/Sq Ft
Est. Value
About This Home
This home is located at 267 School St, Cotuit, MA 02635 and is currently estimated at $644,570, approximately $429 per square foot. 267 School St is a home located in Barnstable County with nearby schools including West Villages Elementary School, Barnstable United Elementary School, and Barnstable Intermediate School.
Ownership History
Date
Name
Owned For
Owner Type
Purchase Details
Closed on
Jun 21, 2024
Sold by
Caraber Pamela
Bought by
Pamela Jane Caraber T and Pamela Caraber
Current Estimated Value
Purchase Details
Closed on
Aug 19, 1997
Sold by
Pierson Elizabeth L and Higgins Jeffrey R
Bought by
Caraber Pamela J
Create a Home Valuation Report for This Property
The Home Valuation Report is an in-depth analysis detailing your home's value as well as a comparison with similar homes in the area
Home Values in the Area
Average Home Value in this Area
Purchase History
| Date | Buyer | Sale Price | Title Company |
|---|---|---|---|
| Pamela Jane Caraber T | -- | None Available | |
| Pamela Jane Caraber T | -- | None Available | |
| Caraber Pamela J | $130,000 | -- | |
| Caraber Pamela J | $130,000 | -- |
Source: Public Records
Mortgage History
| Date | Status | Borrower | Loan Amount |
|---|---|---|---|
| Previous Owner | Caraber Pamela J | $248,000 | |
| Previous Owner | Caraber Pamela J | $200,000 |
Source: Public Records
Tax History
| Year | Tax Paid | Tax Assessment Tax Assessment Total Assessment is a certain percentage of the fair market value that is determined by local assessors to be the total taxable value of land and additions on the property. | Land | Improvement |
|---|---|---|---|---|
| 2025 | $3,997 | $478,700 | $264,900 | $213,800 |
| 2024 | $3,782 | $479,900 | $264,900 | $215,000 |
| 2023 | $3,734 | $446,100 | $262,100 | $184,000 |
| 2022 | $3,325 | $321,600 | $167,900 | $153,700 |
| 2021 | $3,553 | $307,400 | $178,400 | $129,000 |
| 2020 | $3,555 | $303,600 | $188,900 | $114,700 |
| 2019 | $3,495 | $294,200 | $199,400 | $94,800 |
| 2018 | $3,121 | $275,800 | $198,900 | $76,900 |
| 2017 | $3,317 | $281,100 | $204,400 | $76,700 |
| 2016 | $3,257 | $283,000 | $206,300 | $76,700 |
| 2015 | $3,282 | $284,900 | $201,600 | $83,300 |
Source: Public Records
Map
Nearby Homes
- 181 School St
- 239 Oxford Dr
- 15 Riverview Ave Unit D
- 15 Riverview Ave Unit D
- 30 Wings Ln
- 1081 Main St
- 925 Main St Unit 3
- 33 Oyster Place Rd
- 804 Main St
- 6 Cedar St
- 6 Cedar St
- 7 Oxford Dr
- 552 Main St
- 30 Pleasant Park Dr
- 311 Waquoit Rd
- 10 Abbey Gate Rd
- 640 Poponessett Rd
- 640 Poponessett Rd
- 135 Putnam Avenue (Land)
- 11 Teal Cir
Your Personal Tour Guide
Ask me questions while you tour the home.