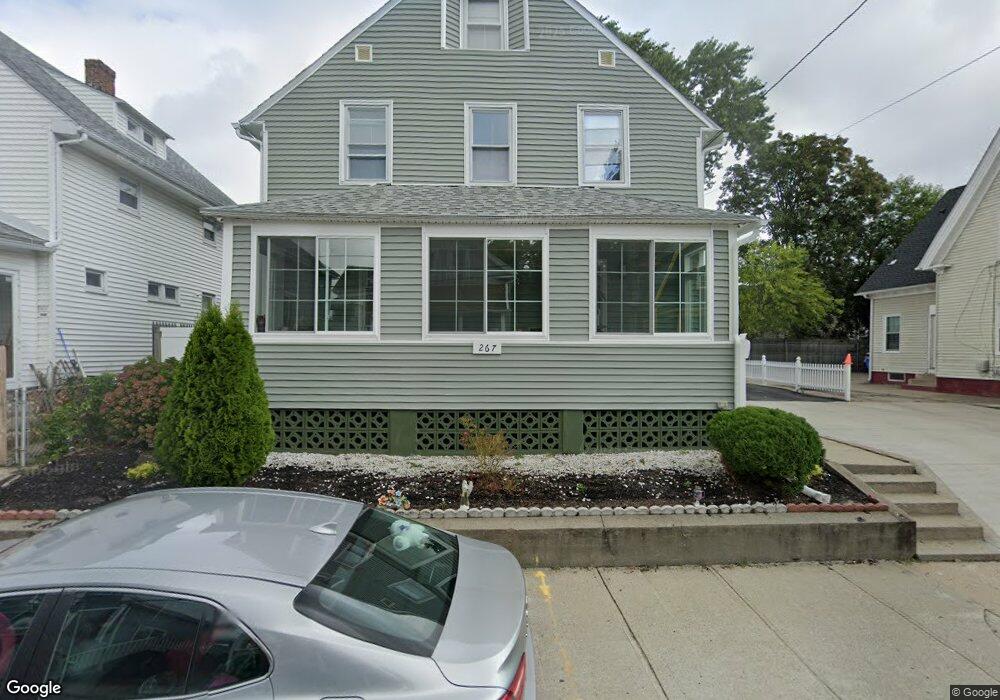
267 Smith St Cranston, RI 02905
Edgewood NeighborhoodEstimated Value: $392,000 - $429,000
5
Beds
3
Baths
2,239
Sq Ft
$184/Sq Ft
Est. Value
About This Home
This home is located at 267 Smith St, Cranston, RI 02905 and is currently estimated at $411,309, approximately $183 per square foot. 267 Smith St is a home located in Providence County with nearby schools including Edgewood Highland Elementary School, Park View Middle School, and Cranston High School East.
Ownership History
Date
Name
Owned For
Owner Type
Purchase Details
Closed on
Jan 11, 2010
Sold by
Almanzar Oscar
Bought by
Sicard Roseangel
Current Estimated Value
Home Financials for this Owner
Home Financials are based on the most recent Mortgage that was taken out on this home.
Original Mortgage
$117,826
Outstanding Balance
$76,378
Interest Rate
4.78%
Mortgage Type
Purchase Money Mortgage
Estimated Equity
$334,931
Create a Home Valuation Report for This Property
The Home Valuation Report is an in-depth analysis detailing your home's value as well as a comparison with similar homes in the area
Home Values in the Area
Average Home Value in this Area
Purchase History
| Date | Buyer | Sale Price | Title Company |
|---|---|---|---|
| Sicard Roseangel | $120,000 | -- |
Source: Public Records
Mortgage History
| Date | Status | Borrower | Loan Amount |
|---|---|---|---|
| Open | Sicard Roseangel | $31,180 | |
| Closed | Sicard Roseangel | $11,267 | |
| Open | Sicard Roseangel | $117,826 |
Source: Public Records
Tax History
| Year | Tax Paid | Tax Assessment Tax Assessment Total Assessment is a certain percentage of the fair market value that is determined by local assessors to be the total taxable value of land and additions on the property. | Land | Improvement |
|---|---|---|---|---|
| 2025 | $4,675 | $336,800 | $103,600 | $233,200 |
| 2024 | $4,584 | $336,800 | $103,600 | $233,200 |
| 2023 | $3,814 | $201,800 | $45,400 | $156,400 |
| 2022 | $3,735 | $201,800 | $45,400 | $156,400 |
| 2021 | $3,632 | $201,800 | $45,400 | $156,400 |
| 2020 | $3,325 | $160,100 | $35,700 | $124,400 |
| 2019 | $3,325 | $160,100 | $35,700 | $124,400 |
| 2018 | $3,248 | $160,100 | $35,700 | $124,400 |
| 2017 | $2,553 | $111,300 | $16,200 | $95,100 |
| 2016 | $2,499 | $111,300 | $16,200 | $95,100 |
| 2015 | $2,499 | $111,300 | $16,200 | $95,100 |
| 2014 | $2,412 | $105,600 | $16,200 | $89,400 |
Source: Public Records
Map
Nearby Homes
- 166 Narragansett St
- 325 Northup St
- 175 Montgomery Ave
- 358 Northup St
- 274 Montgomery Ave
- 273 Montgomery Ave
- 147 Wentworth Ave
- 61 Armington St
- 233 California Ave
- 297 Vermont Ave
- 286 California Ave
- 180 Ohio Ave
- 160 Ohio Ave
- 255 Ohio Ave
- 1180 Narragansett Blvd Unit 1
- 61 Cyr St
- 12 Payton St
- 374 New York Ave
- 1232 Narragansett Blvd
- 77 Payton St
Your Personal Tour Guide
Ask me questions while you tour the home.