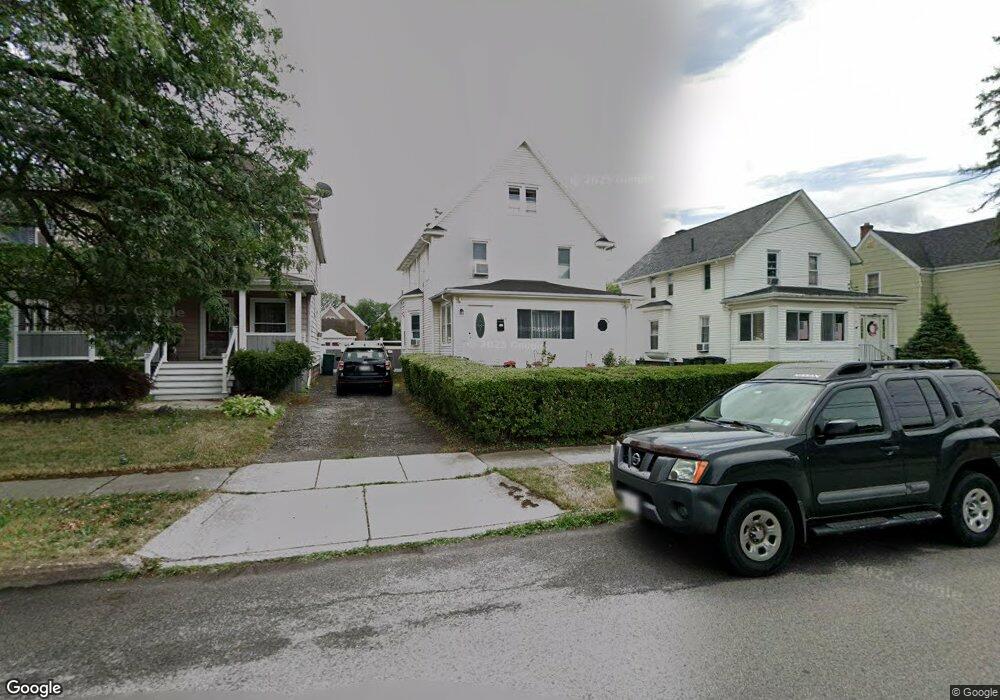
267 Sommer St North Tonawanda, NY 14120
Estimated Value: $186,000 - $229,981
4
Beds
2
Baths
2,304
Sq Ft
$91/Sq Ft
Est. Value
About This Home
This home is located at 267 Sommer St, North Tonawanda, NY 14120 and is currently estimated at $209,745, approximately $91 per square foot. 267 Sommer St is a home located in Niagara County with nearby schools including North Tonawanda Intermediate School, St Matthew Lutheran School, and New Life Christian School.
Ownership History
Date
Name
Owned For
Owner Type
Purchase Details
Closed on
Mar 27, 2008
Sold by
Grichen Mark
Bought by
Khasanova Rashinarz
Current Estimated Value
Home Financials for this Owner
Home Financials are based on the most recent Mortgage that was taken out on this home.
Original Mortgage
$78,358
Outstanding Balance
$49,090
Interest Rate
5.76%
Mortgage Type
FHA
Estimated Equity
$160,655
Purchase Details
Closed on
Mar 19, 2004
Sold by
Keller Arline
Bought by
Grichen Mark
Create a Home Valuation Report for This Property
The Home Valuation Report is an in-depth analysis detailing your home's value as well as a comparison with similar homes in the area
Home Values in the Area
Average Home Value in this Area
Purchase History
| Date | Buyer | Sale Price | Title Company |
|---|---|---|---|
| Khasanova Rashinarz | $79,000 | Lana Lissai | |
| Grichen Mark | $64,500 | Randy H Gugino |
Source: Public Records
Mortgage History
| Date | Status | Borrower | Loan Amount |
|---|---|---|---|
| Open | Khasanova Rashinarz | $78,358 |
Source: Public Records
Tax History Compared to Growth
Tax History
| Year | Tax Paid | Tax Assessment Tax Assessment Total Assessment is a certain percentage of the fair market value that is determined by local assessors to be the total taxable value of land and additions on the property. | Land | Improvement |
|---|---|---|---|---|
| 2024 | $2,789 | $79,000 | $15,500 | $63,500 |
| 2023 | $2,720 | $79,000 | $15,500 | $63,500 |
| 2022 | $2,242 | $79,000 | $15,500 | $63,500 |
| 2021 | $2,201 | $79,000 | $15,500 | $63,500 |
| 2020 | $2,107 | $79,000 | $15,500 | $63,500 |
| 2019 | $1,082 | $79,000 | $15,500 | $63,500 |
| 2018 | $2,042 | $79,000 | $15,500 | $63,500 |
| 2017 | $1,985 | $79,000 | $15,500 | $63,500 |
| 2016 | $1,915 | $79,000 | $15,500 | $63,500 |
| 2015 | -- | $79,000 | $15,500 | $63,500 |
| 2014 | -- | $79,000 | $15,500 | $63,500 |
Source: Public Records
Map
Nearby Homes