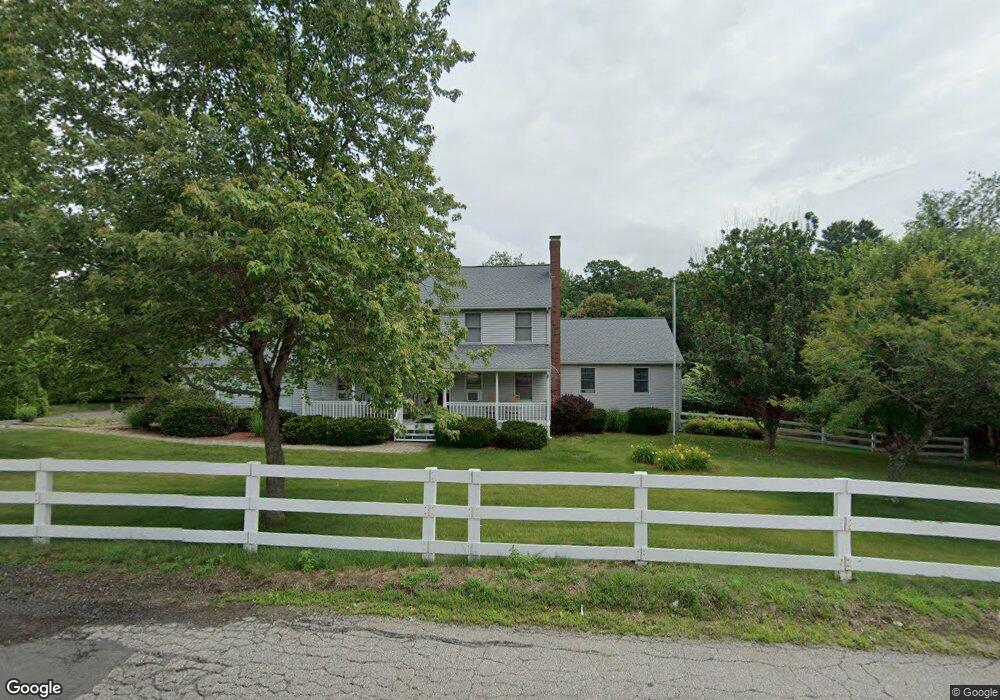
267 South St Auburn, MA 01501
Pondville NeighborhoodEstimated Value: $689,000 - $805,000
4
Beds
3
Baths
2,394
Sq Ft
$306/Sq Ft
Est. Value
About This Home
This home is located at 267 South St, Auburn, MA 01501 and is currently estimated at $731,967, approximately $305 per square foot. 267 South St is a home located in Worcester County with nearby schools including Auburn Senior High School and Shrewsbury Montessori School - Auburn Campus.
Ownership History
Date
Name
Owned For
Owner Type
Purchase Details
Closed on
Jul 22, 1997
Sold by
Emerson Homes Inc
Bought by
Wilcox Alan E and Wilcox Carol J
Current Estimated Value
Home Financials for this Owner
Home Financials are based on the most recent Mortgage that was taken out on this home.
Original Mortgage
$193,500
Interest Rate
7.79%
Mortgage Type
Purchase Money Mortgage
Create a Home Valuation Report for This Property
The Home Valuation Report is an in-depth analysis detailing your home's value as well as a comparison with similar homes in the area
Home Values in the Area
Average Home Value in this Area
Purchase History
| Date | Buyer | Sale Price | Title Company |
|---|---|---|---|
| Wilcox Alan E | $215,000 | -- |
Source: Public Records
Mortgage History
| Date | Status | Borrower | Loan Amount |
|---|---|---|---|
| Open | Wilcox Alan E | $60,000 | |
| Open | Wilcox Alan E | $187,500 | |
| Closed | Wilcox Alan E | $193,500 |
Source: Public Records
Tax History Compared to Growth
Tax History
| Year | Tax Paid | Tax Assessment Tax Assessment Total Assessment is a certain percentage of the fair market value that is determined by local assessors to be the total taxable value of land and additions on the property. | Land | Improvement |
|---|---|---|---|---|
| 2025 | $7,894 | $552,400 | $133,000 | $419,400 |
| 2024 | $8,249 | $552,500 | $129,400 | $423,100 |
| 2023 | $7,875 | $495,900 | $117,700 | $378,200 |
| 2022 | $7,256 | $431,400 | $117,700 | $313,700 |
| 2021 | $7,091 | $390,900 | $103,900 | $287,000 |
| 2020 | $11,985 | $390,900 | $103,900 | $287,000 |
| 2019 | $7,031 | $381,700 | $102,700 | $279,000 |
| 2018 | $10,764 | $376,400 | $96,100 | $280,300 |
| 2017 | $6,749 | $368,000 | $87,700 | $280,300 |
| 2016 | $6,585 | $364,000 | $90,100 | $273,900 |
| 2015 | $6,286 | $364,200 | $90,100 | $274,100 |
| 2014 | $6,152 | $355,800 | $85,900 | $269,900 |
Source: Public Records
Map
Nearby Homes
- 9 Santom St
- 361 South St
- 19 Elizabeth Rd
- 12 Coachman Ln
- 611 Oxford St S
- 387 W Main St
- 751 Washington St Unit 33
- 45 Loring St
- 853 Oxford St S
- 70 S Oxford Rd
- 6 Linden Ln
- 4 Linden Ln
- 857 Oxford St S
- 359 W Main St
- 156 Central St
- 190 Federal Hill Rd
- 4 Whitetail Run
- 19 Garden St
- 6 Whitetail Run
- 3 Lancaster St